Fig. 2.

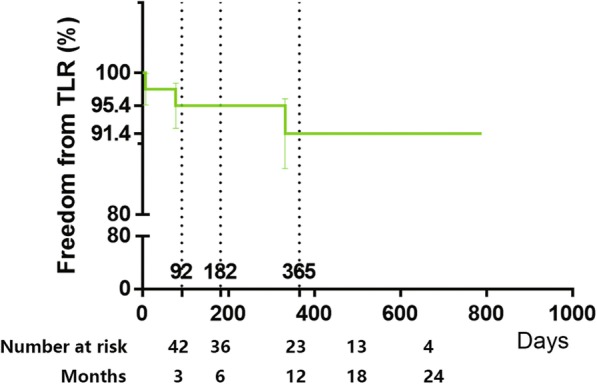
Freedom from TLR Endpoint. Kaplan-Meier curves shows cumulative probability of freedom from TLR of this study over an average 1-year follow-up period

Freedom from TLR Endpoint. Kaplan-Meier curves shows cumulative probability of freedom from TLR of this study over an average 1-year follow-up period