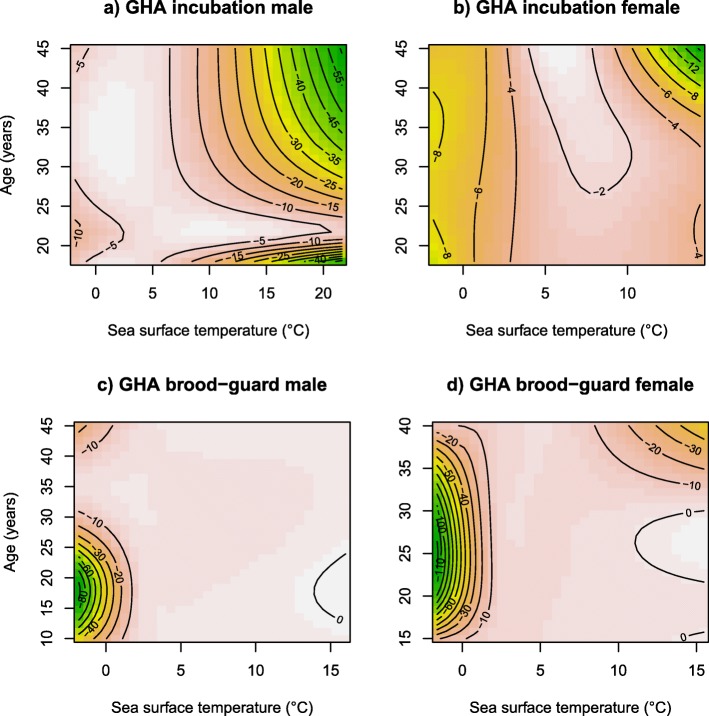
Fig. 6.
Contour plots (a-d) of most important variables explaining the distribution of grey-headed albatrosses (GHA) foraging bouts during the incubation and brood-guard breeding stages. Probability of foraging bout occurrence for birds of different ages and values of sea surface temperature is represented by color (high probability of occurrence; red, low probability of occurrence; green)

