
Fig. 3.
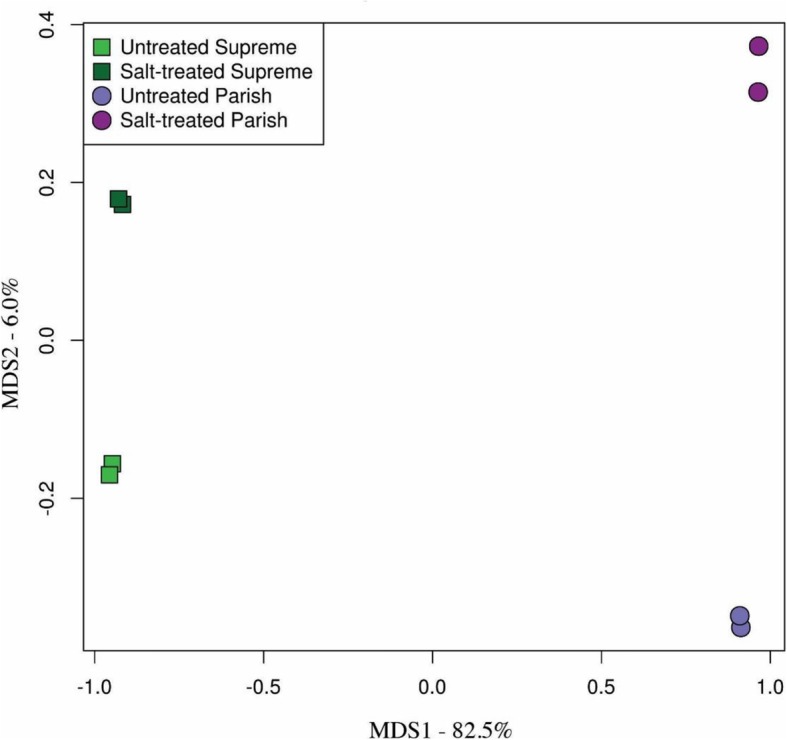
MDS plot showing reproducibility among two biological replicates of our RNA-seq samples. The MDS plot was generated by using the expected counts generated by RSEM to ordinate samples in multidimensional space based on differences in expression values. The close clustering of biological replicates indicates a high degree of consistency across all genes. The percentage of variance in the X axis indicating the difference of the two plant types is 82.5% while the percentage of variance in the Y axis indicating the difference of non-treated and salt-treated samples is 6.0%