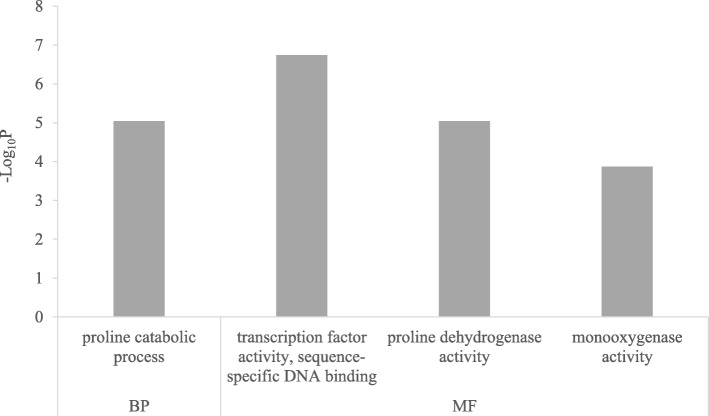
Fig. 6.
Functional enrichment analysis for salt-induced genes that show higher expression in Supreme than in Parish under normal conditions. The x-axis shows significantly enriched gene ontology (GO) terms (P < 0.05, Bonferroni < 0.05) in two categories, Biological Process (BP) and Molecular Function (MF). The y-axis shows the –log10P values of these terms

