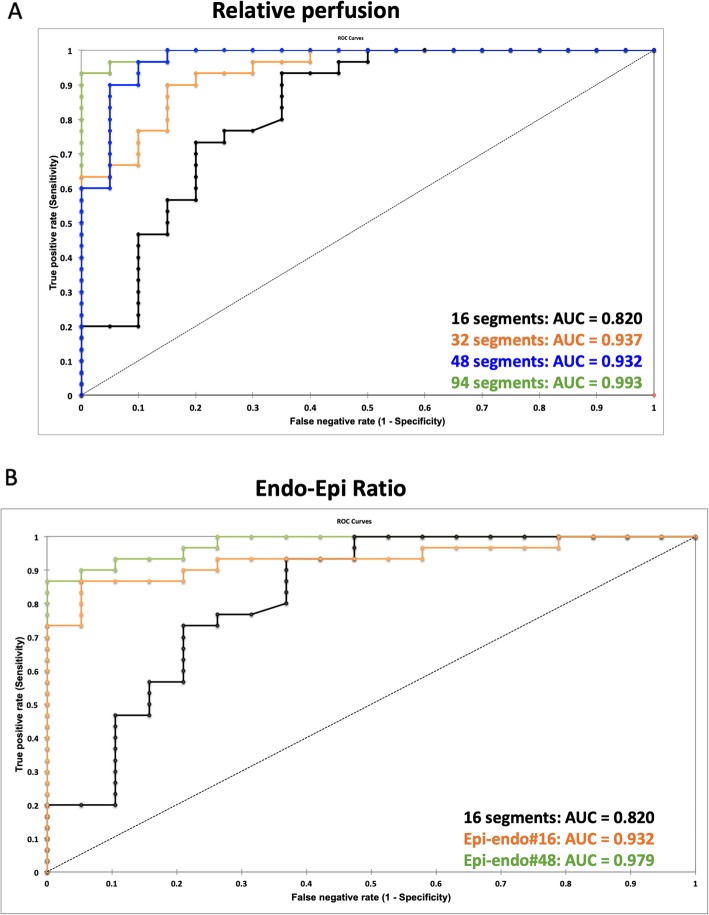
Fig. 3.
Results of receiver operator characteristics (ROC) curve analysis in identifying subjects with significant coronary artery disease (CAD). a: ROC curves for 16 segments (black), 32 segments (orange) and 96 segments (green); b: ROC curves for 16 segments (black), endo−/epicardial ratio based on 32 segments (orange) and endo−/epicardial ratio based on 96 segments (green)

