Figure 1.

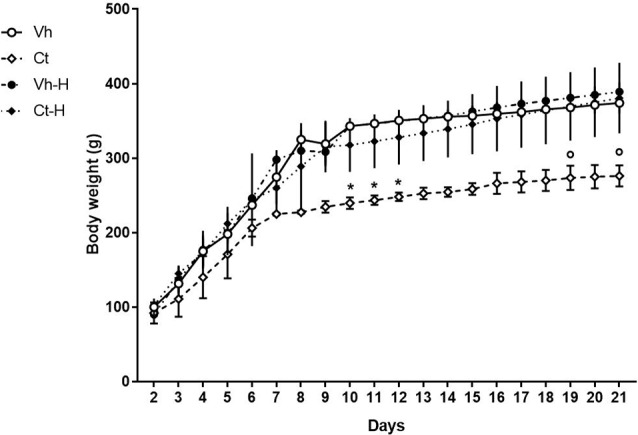
Graph showing the effect of prenatal corticosterone on body weight from postnatal day 2 until 21. Each value represents the mean ± SD of 10 rats. *p < 0.05 vs. Vh, °p < 0.05 vs. Vh-H.

Graph showing the effect of prenatal corticosterone on body weight from postnatal day 2 until 21. Each value represents the mean ± SD of 10 rats. *p < 0.05 vs. Vh, °p < 0.05 vs. Vh-H.