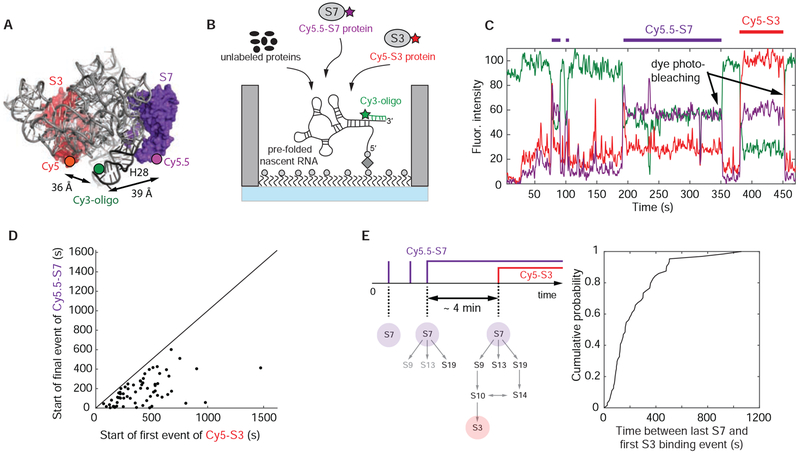
Figure 6. Correlating S7 with S3 binding.
(A) 3-dimensional structure of E. coli 30S ribosomal subunit with labeling sites for Cy5-S3 and Cy5.5-S7 (PDB accession code: 4V9P); the Cy3 dye of the labeled DNA oligonucleotide binding to the 3’-end of the nascent RNA is modeled into the structure. (B) Experimental setup: 100 nM Cy5-S3, 5 nM Cy5.5-S7 and 400 nM of all the other unlabeled 3’domain r-proteins were injected; 35 °C. (C) Representative single-molecule trace with Cy5-S3 (red), Cy5.5-S7 (purple) and Cy3-oligo (green). The trace was not corrected for fluorescence spectral bleed-through from the Cy5 into the Cy5.5 channel and the reverse. (D) The first Cy5-S3 binding event always follows the final Cy5.5-S7 binding event demonstrating sequential ribosome assembly. (E) The assembly process from stable S7 incorporation until 3’domain completion is slow, indicating that RNA conformational changes are also required later in assembly. Number of molecules analyzed in (D and E) (n) = 64. See also Figure S7 and Data S2.

