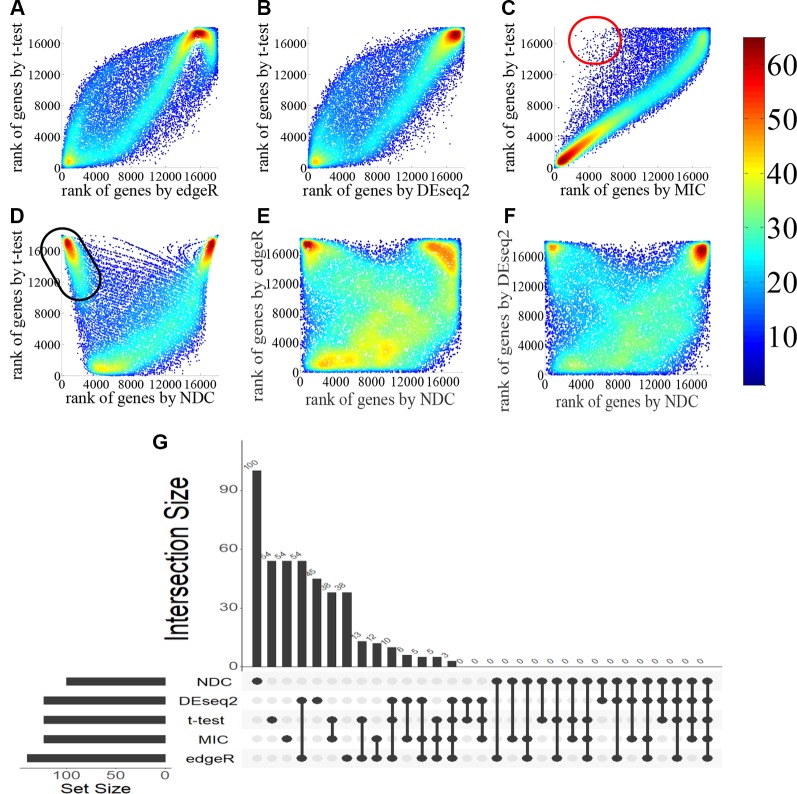
Figure 2.
Comparison of gene ranking by t-test, edgeR, DEseq2, maximal information coefficient (MIC), and normalized differential correlation (NDC) for the lung squamous cell carcinoma (LUSC) dataset. In (A–F): the color indicating data density; The red and black circles are just approximate region to visualize that, there are some genes can be highlighted by DNC methods, but cannot be highlighted by t-test. (G) overlaps of the top 100 genes selected by five methods.

