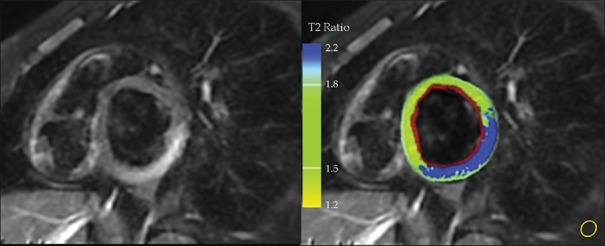
Figure 1.
Regional myocardial edema assessment in a patient with acute myocarditis. Left, T2w-Short-tau inversion-recovery image with an increased signal intensity region mostly affecting segment 4 segments 5 of the left ventricular wall with a subepicardial to mid-wall distribution. Right, computer-aided signal intensity analysis of the T2-weighted image with color-coded display of relative signal intensity, normalized to skeletal muscle (region of interest, lower right part). Blue color: signal intensity ratio of myocardial/skeletal muscle of >2.0, indicating edema along 4 and 5 segments, green color: normal signal intensity

