Figure 4.

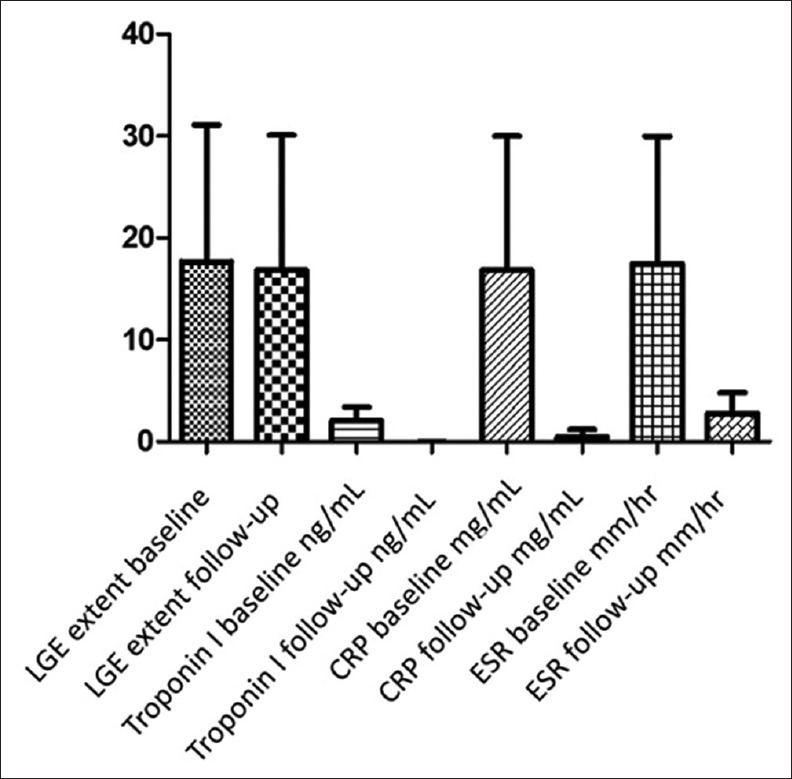
Bar chart indicating late gadolinium enhancement extent, Troponin I, c-reactive protein and erythrocyte sedimentation rate levels at baseline (left bar) and at 12-month (right bar) follow-up study

Bar chart indicating late gadolinium enhancement extent, Troponin I, c-reactive protein and erythrocyte sedimentation rate levels at baseline (left bar) and at 12-month (right bar) follow-up study