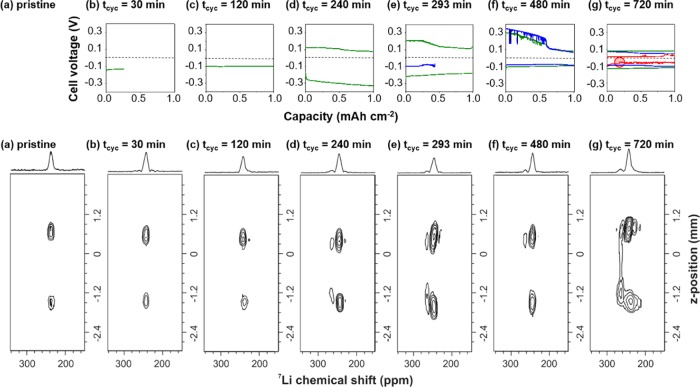
Figure 3.
Galvanostatic cycling at 0.5 mA/cm2 for a maximum of 2 h per discharge/charge (plating/stripping) (top) of Li–LLZTO–Li symmetrical cells stopped for ex situ analysis with 7Li CSI (bottom) for (a) pristine, (b) tcyc = 30 min, (c) tcyc = 120 min, (d) tcyc = 240 min, (e) tcyc = 293 min, (f) tcyc = 480 min, and (g) tcyc = 720 min. The first, second, and third cycles are shown in green, blue, and red, respectively. The short-circuit that occurred in (g) at 501 min is highlighted with a red circle. A detailed EIS analysis of all cells is shown in Table S2.

