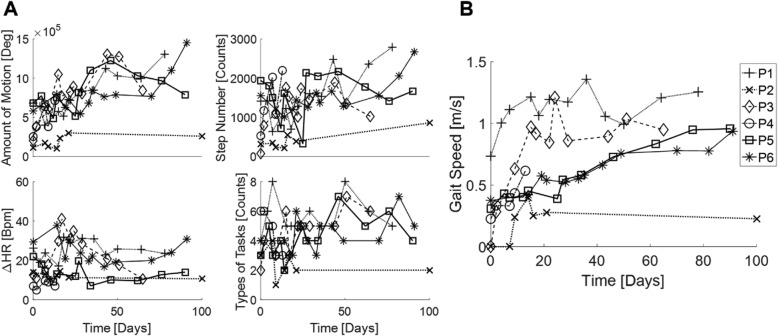
Fig. 2.
a, Changes in features of therapy dosage over time (top left) total amount of motion, (top right) step number, (bottom left) average change in heart rate from baseline, (bottom right) types of tasks performed for all subjects recorded. b, Changes in outcome measure of average gait speed over time

