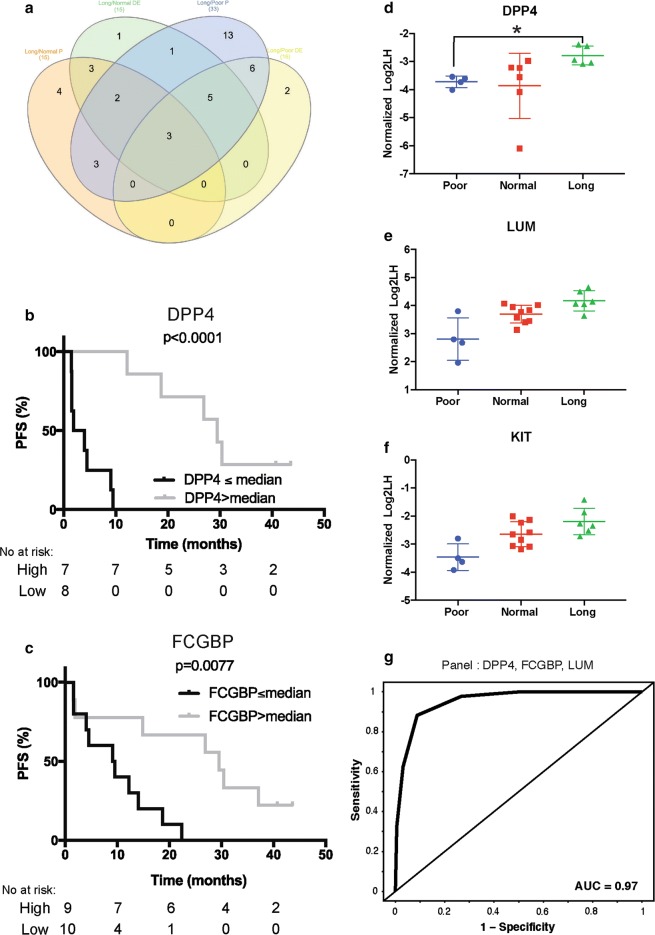
Fig. 3.
Candidate proteins to classify ALK + NSCLC patients by duration of response to crizotinib. a Venn Diagram of the protein list identified with both methods (differential expression = DE, classifier = P) and both comparisons (Long vs Normal and Long vs Poor). Kaplan–Meier plots where patients were separated in two groups based on the median expression value of DPP4 (b) or FCGBP (c) two of the top contributing protein in long versus normal panel analysis. d–f Normalized log2LH ratio of three proteins (DPP4, LUM, KIT) in each of the response groups. g ROC curve of one of the best panels obtained in long versus normal comparison which includes DPP4, FCGBP and LUM

