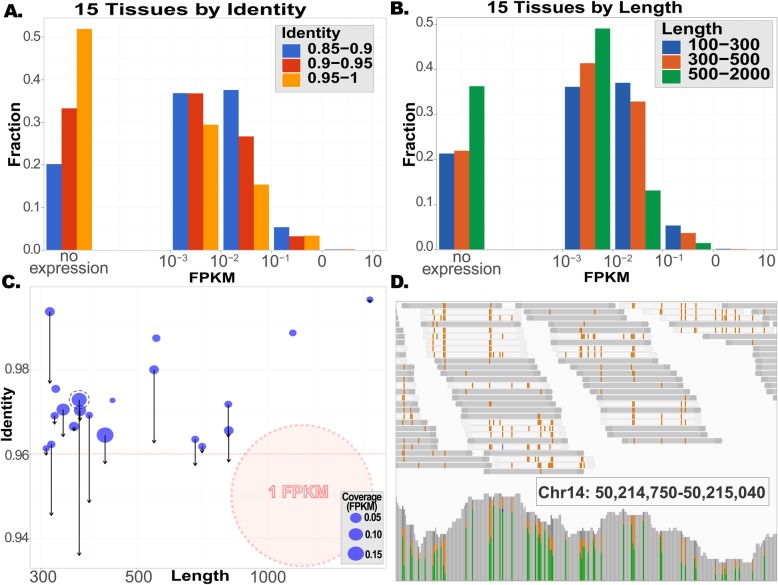
Fig. 4.
Expression and editing of long and nearly perfect duplexes. Depletion of long and nearly perfect dsRNAs from the human transcriptome is more pronounced for regions that are expressed more strongly. In this figure, expression was calculated based on a pool of 30 GTEx samples, from 15 different tissues (Additional file 1: Table S6). a Distribution of dsRNA tightness (%identity) for several expression levels. Many of these regions are not expressed at all, and the ones that are (very weakly) expressed show a reduced fraction of nearly perfect (> 95%) structures. b Similarly, long structures are depleted in the expressed regions, compared with the ones that show no expression. c Twenty long and nearly perfect human structures were expressed at a level exceeding FPKM = 0.01 (roughly, 0.002–0.02 RNA molecules per cell [31]). Seven of these (including the two structures expressed at levels exceeding FPKM = 0.1) are indeed edited appreciably (black arrows), possibly bringing the edited structure below 96% identity. The single point marked by a dashed line corresponds to the data presented in d. d Actual editing pattern for one of the unwound structures. A putative dsRNA structure, located within an intron of klhdc1 (chr14:50213276-50215083), is expressed in our pool at a level of FPKM = 0.13. These transcripts are heavily edited, with an estimated number of 14 inosines per transcript, on average. Top: reads mapped to 1 of the 2 arms of the structure (see region coordinates noted in the panel). Data accumulates reads from the 30 pooled samples. Editing events (A-to-G mismatches) show up in brown. Bottom: pile-up of the reads coverage, 59 different editing sites are observed in this 291-bp-long region. They are marked by green and brown bars (standing for A and G fractions, respectively)

