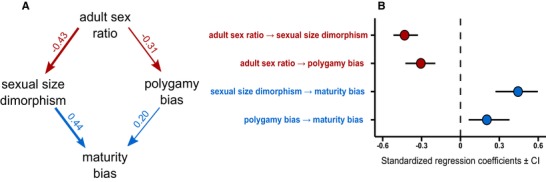
Figure 3.

Path diagram (A) and standardized regression coefficients ± 95% confidence intervals (B) of the phylogenetic path model with strongest support by our data (Model 2). In panel (A), red and blue arrows indicate negative and positive relationships, respectively, and numbers represent standardized regression coefficients. In panel (B), red and blue dots indicate negative and positive relationships, respectively. Three randomly selected phylogenies provided similar results.
