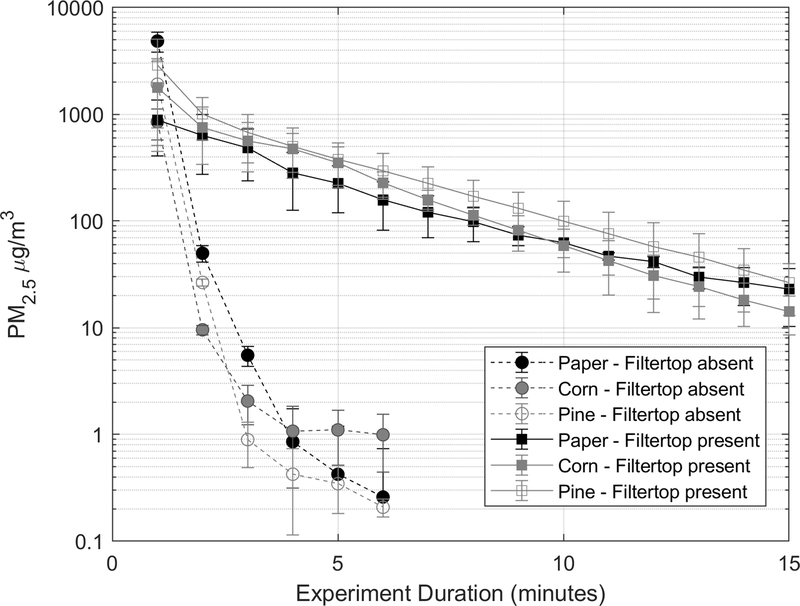
Figure 4.
PM2.5 concentration decay curves of mechanically generated dust from pine bedding material inside the cages during filter top lid present and absent conditions. Error bars represent standard deviation. The flow rate through the cage was 6 L/min. See Table 1 for corresponding decay constants.

