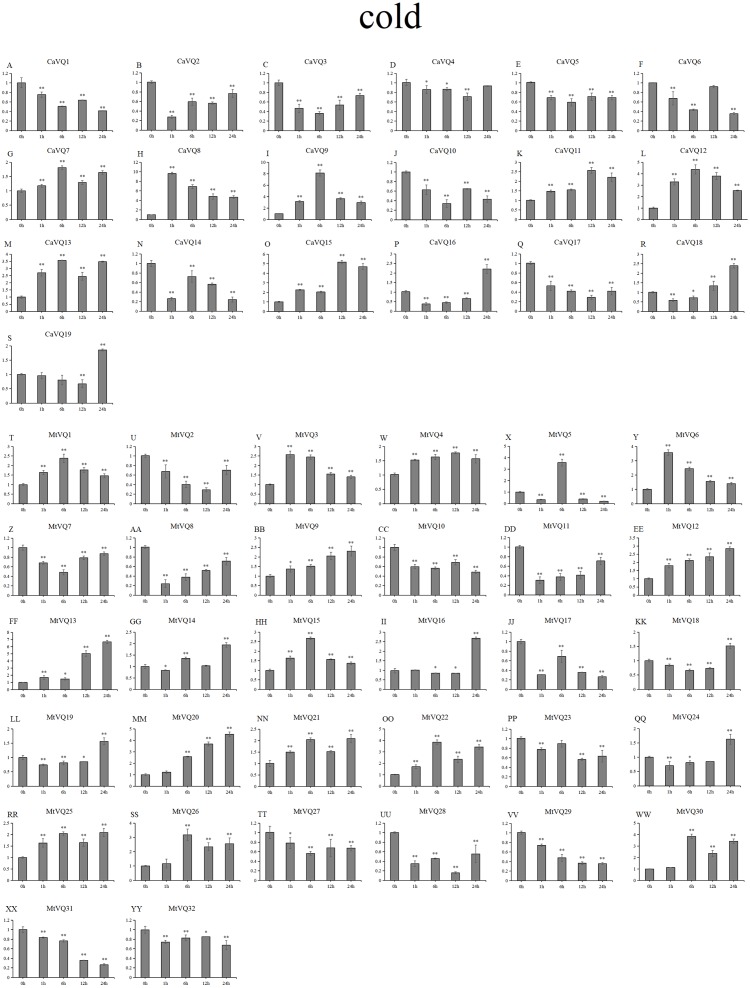
Figure 10. qRT-PCR validation of VQ genes in the response to cold treatment.
Stress treatments and time course are described in “Materials & Methods”. (A-YY) represent different genes which were used in qRT-PCR analysis. Asterisks on top of the bars indicating statistically significant differences between the stress and counterpart controls (∗p < 0.05, ∗∗p < 0.01).

