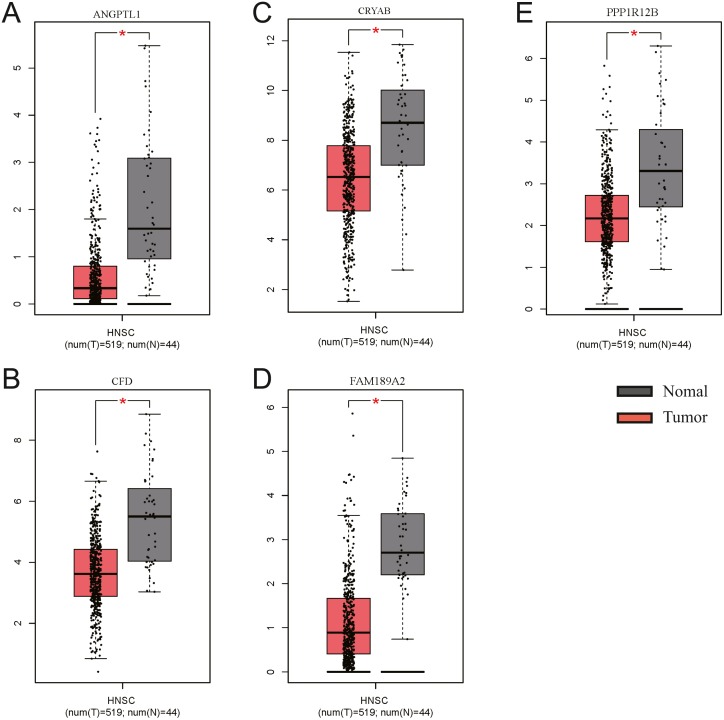
Figure 14. Validation of the gene expression of the five hub genes between OSCC samples and normal tissue from GEPIA.
We obtained similar results as above. (A) The gene expression of ANGPTL1 between OSCC samples and normal tissue from GEPIA. (B) The gene expression of CFD between OSCC samples and normal tissue from GEPIA. (C) The gene expression of CRTAB between OSCC samples and normal tissue from GEPIA. (D) The gene expression of FAM189A2 between OSCC samples and normal tissue from GEPIA. (E) The gene expression of PPP1R12B between OSCC samples and normal tissue from GEPIA.

