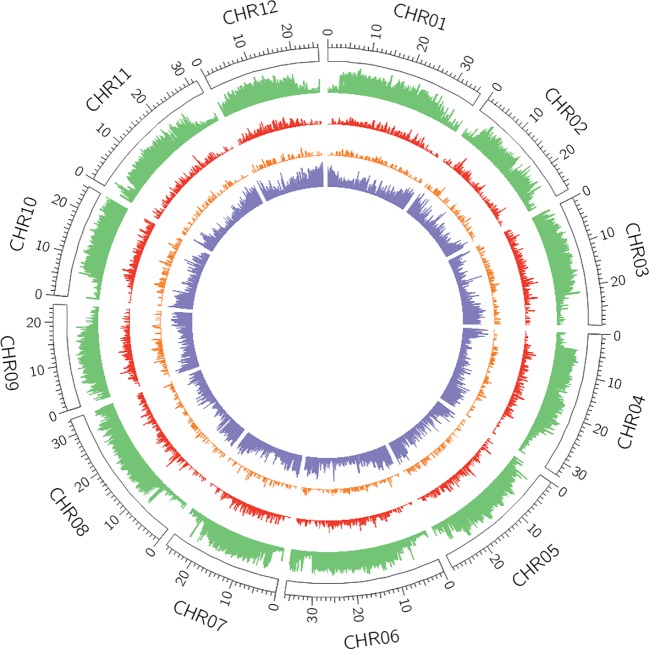
Figure 3.
Distribution of transposable elements (TEs) and genes across v4.0 pseudomolecules. In green, density of REPET features per window (6,000 windows in total). In red, density of full-length Long Terminal Repeat (LTR)-retrotransposons annotated in the v4.0 that were absent in the v3.6.1 assembly. In orange, density of polymorphic LTR-retrotransposons with insertion time below 2 Mya. In purple, gene density.

