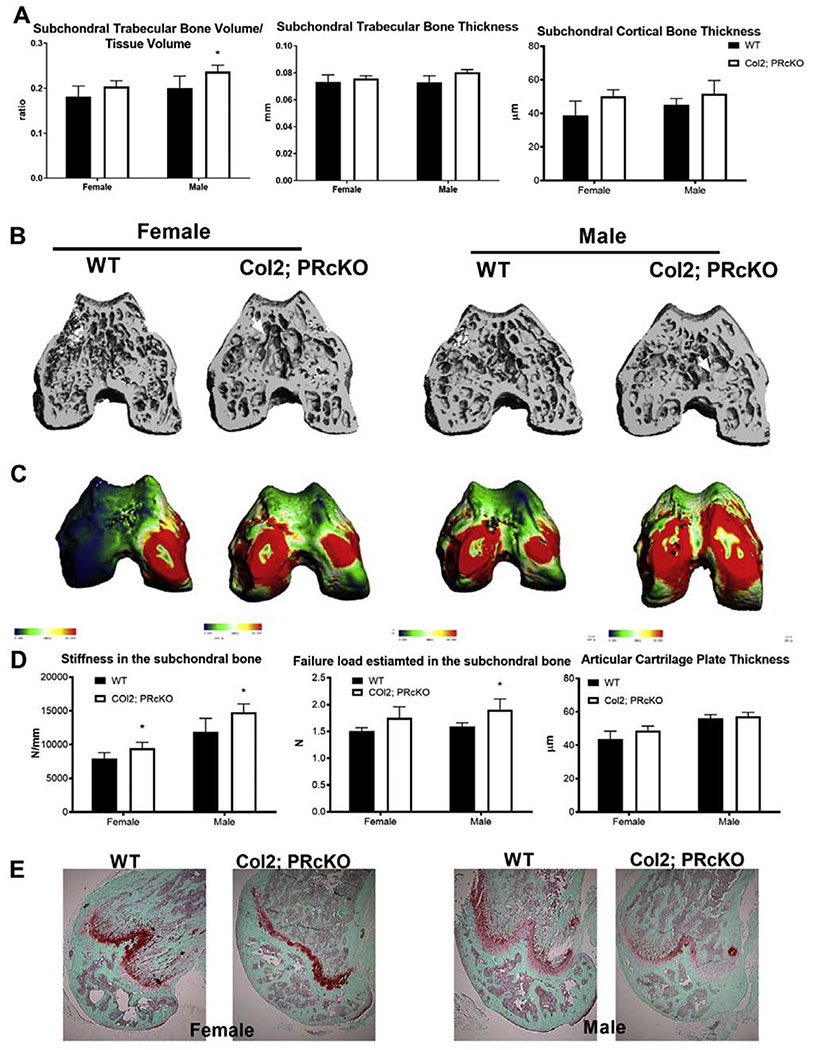
Figure 3.
Subchondral bone microarchitecture and estimated bone strength in Col2; PRcKO mice.
(A) Subchondral bone volume, trabecular bone thickness, and cortical bone thickness measured by microCT. (B) Representative microCT images of the subchondral bone from WT or Col2; PRcKO female and male mice. (C) Representative FEA maps of the distal femur subchondral bone from female and male WT andCol2; PRcKO mice. Blue to red indicated low to high stiffness in a continuous manner. (D) Stiffness and failure load were estimated by FEA analyses at the subchondral bone in 4-month-old WT and Col2; PRcKO mice. N=8-14/group.

