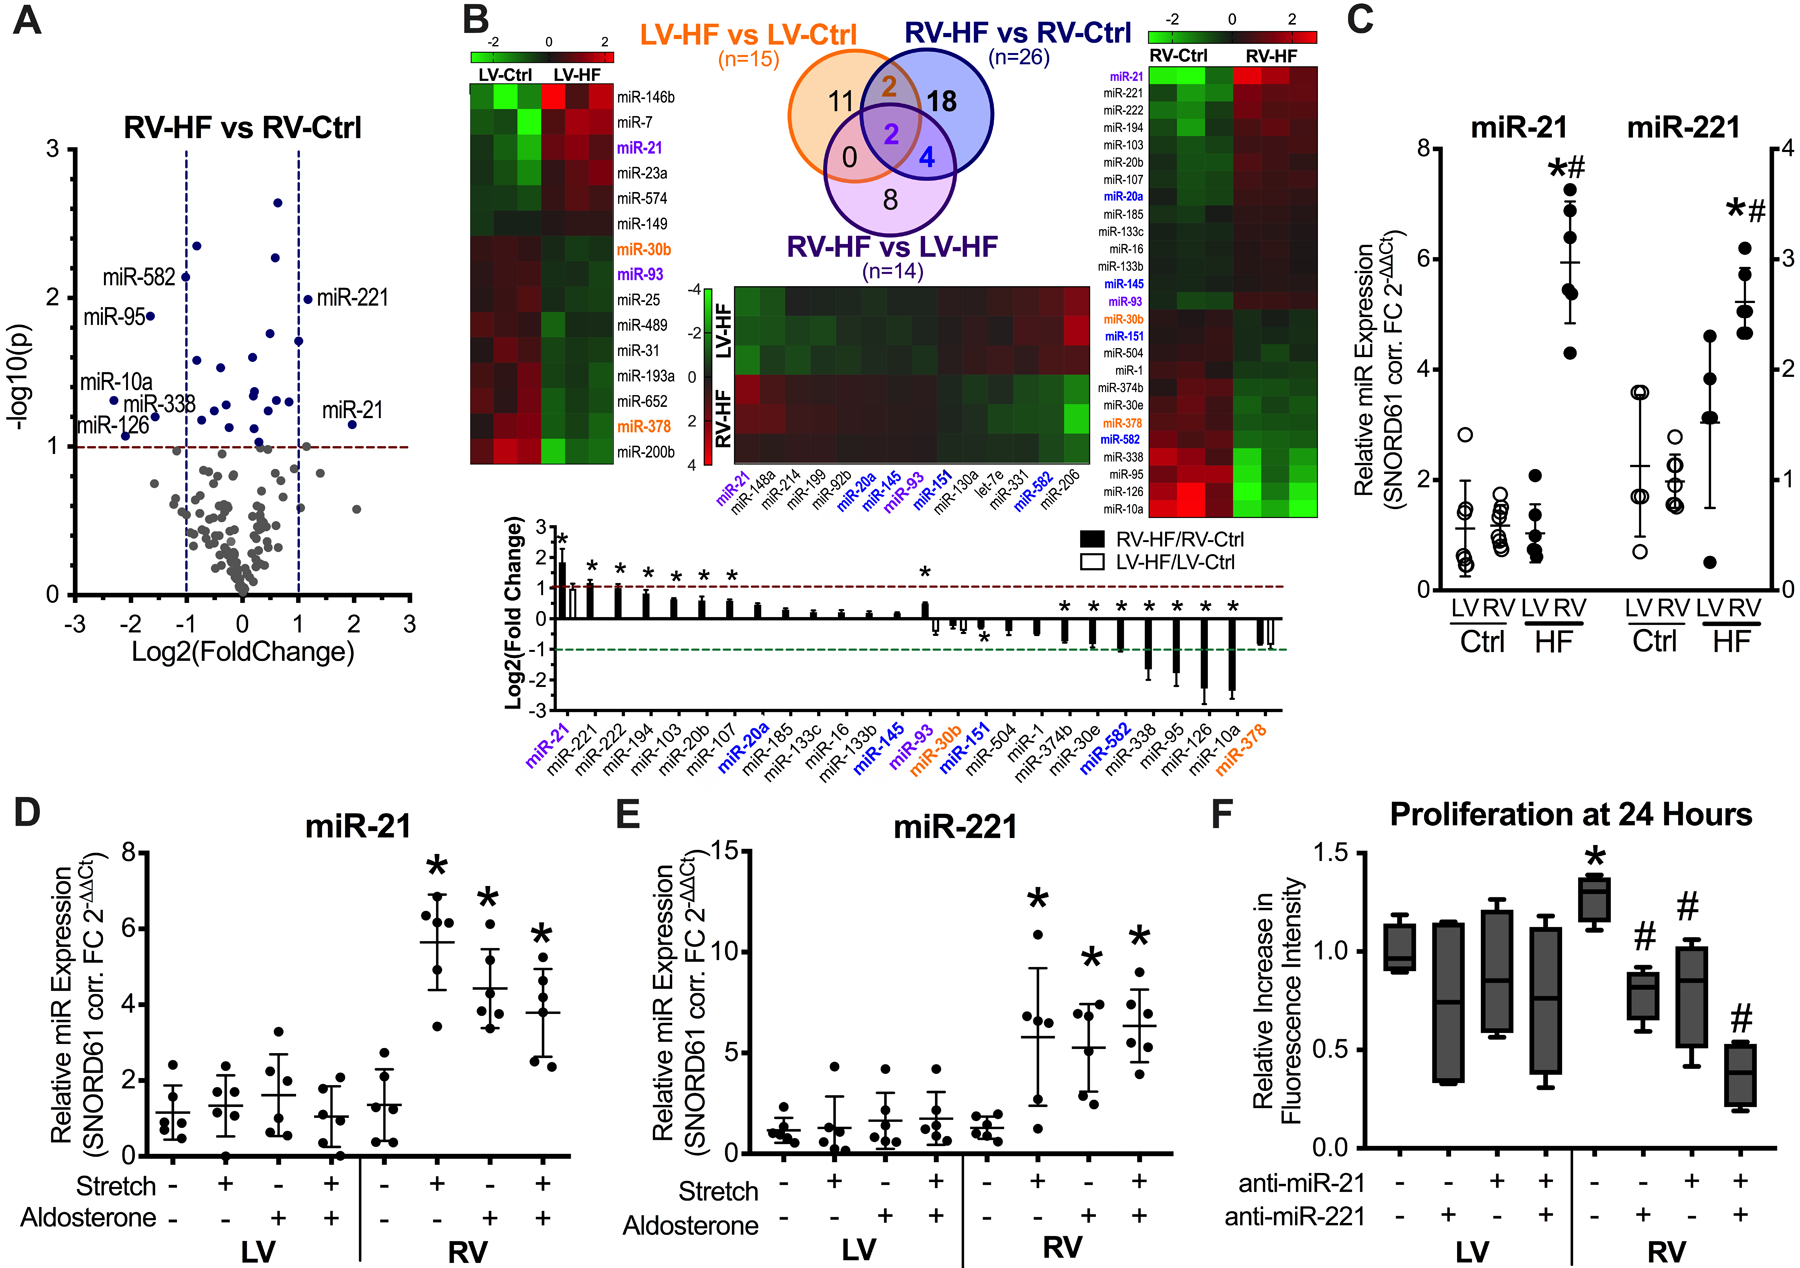
Figure 2. miR-21 and miR-221 are upregulated in the failing RV of tachypacing canine model and in isolated adult canine fibroblasts subjected to cyclic stretch and/or aldosterone stimulation.

(A)Volcano plot of miRNA expression in RV-HF vs RV-Ctrl. Blue dots, miRNAs that were differentially expressed at P<0.10. Labeled dots, miRNAs that were differentially expressed at a minimum 2-fold change in either direction (n=3 per group). (B)Heat maps, Venn diagram, and summary bar graph of differentially expressed miRNAs. Orange font, differentially expressed in RV-HF vs RV-Ctrl and in LV-HF vs LV-Ctrl but not statistically significantly different in RV-HF vs LV-HF. Blue font, differentially expressed in RV-HF vs RV-Ctrl and in RV-HF vs LV-HF, but not statistically significantly different in LV-HF vs LV-Ctrl. Purple font, differentially expressed across all three comparisons: LV-HF vs LV-Ctrl, RV-HF vs RV-Ctrl, and RV-HF vs LV-HF. *P<0.05 vs respective LV-HF/LV-Ctrl. (C)Quantitative RT-PCR analysis of miR-21 and miR-221 in ventricular tissue, n= 6 per group. *P<0.01 vs respective Ctrl; #P<0.01 vs LV HF. (D)Cyclic overstretch and/or aldosterone induced a marked increase in miR-21 (*P<0.01 vs unstimulated) and (E)miR-221 (*P<0.05 vs unstimulated) only in RV fibroblasts. (F)Inhibition of miR-21/−221 attenuated proliferation in RV but not LV fibroblasts. n= 4 per experimental condition. *P<0.05 vs respective LV, #P<0.05 vs RV without antimir, analyzed by ANOVA on Ranks.
