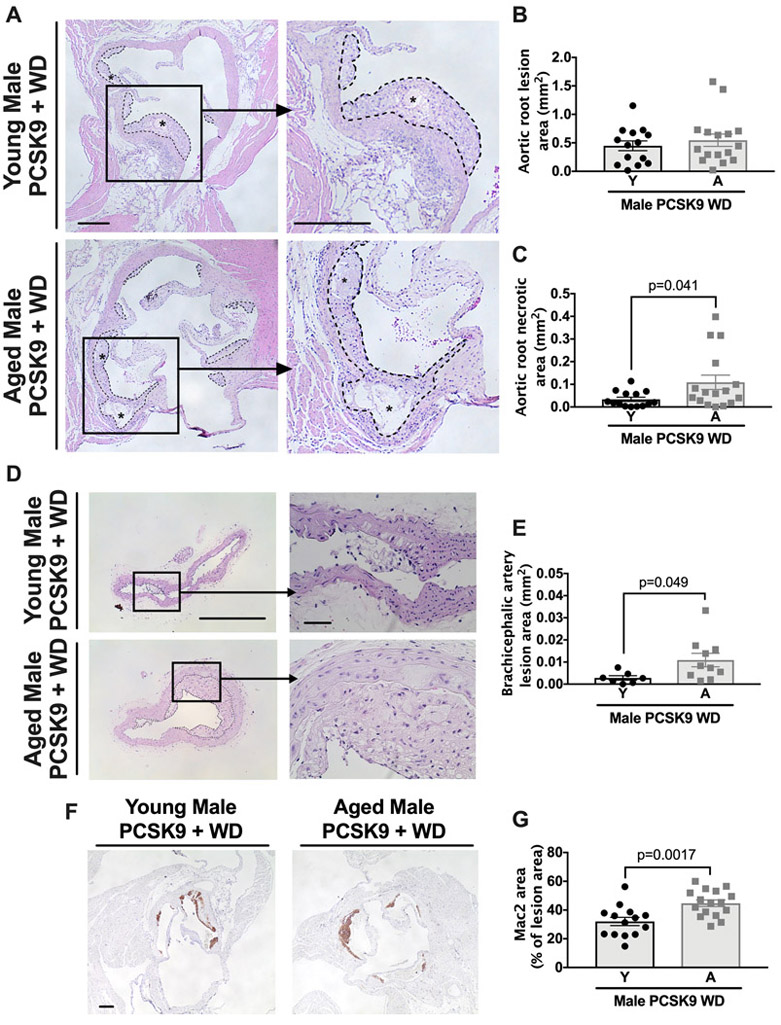
Figure 5. Atherosclerotic lesions show an age-associated increased size of necrosis induced by acute hyperlipidemia.
WT C57BL/6 mice were maintained on a LFD until either 3-months or 18-months and were then transfected with PCSK9-AAV and fed a WD for 10 weeks. At this point, aortic roots were obtained, paraffin-embedded, and stained with H&E. (A) Cross sections of aortic roots from male C57BL/6 mice show total lesion area, outlined in dashed lines, and necrotic core area, denoted by asterisks. Higher magnification shows the presence of necrotic core in aged mice. Scale bars: 100μm. (B and C) Quantification of total lesion area and necrotic core. (D) Cross sections of brachiocephalic artery from male C57BL/6 mice showing total lesion area, outlined in dashed lines. Scale bars: 100μm and 10μm for magnified image. (E) Quantification of total lesion area. (F) Cross sections of the aortic root were stained with Mac2 monoclonal antibody as described in detailed methods. Scale bar: 100μm. (G) Quantification of Mac2 positive staining area as a percentage of the total plaque area. Each data point represents a biological replicate. For atherosclerotic plaque and necrotic area, each biological replicate is the sum of 30 serial sections, 6μm per section. All results are presented as mean ±SEM. Student’s t-test for B, C, and G. Mann-Whitney U-test for E. A=aged, Y=young.

