Figure 5.

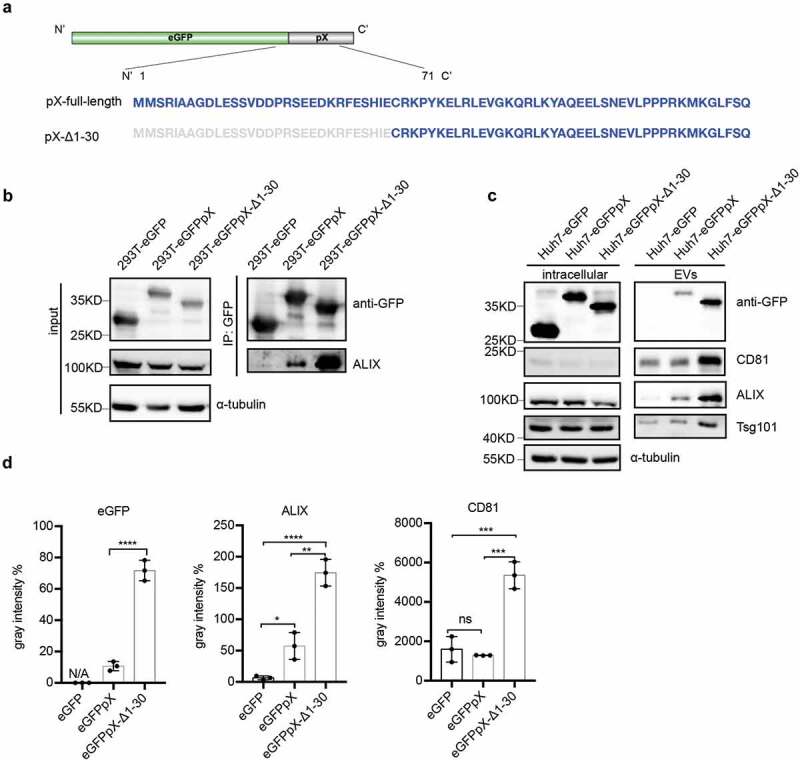
The C-terminal 41 aa of pX determines its interaction with ALIX and exosome-mediated release. (a) Schematic representation of the recombinant eGFPpX-Δ1-30 protein. Δ indicates a truncation. Numbers represent the positions of amino acids. (b) Co-IP assays in 293T cells to confirm the interaction between ALIX and pX or the pX mutant. Anti-GFP nanobody agarose beads were used for co-IP as described above. (c) Western blot analysis of EVs released from the indicated cells. EVs were pelleted by ultracentrifugation at 100,000 ×g as described in the Methods section. (d) Relative quantification of the proteins in EVs. The levels of proteins in the western blot shown in (c) were estimated from three independent replicates by their grey intensity using Fiji. Percentages were calculated by dividing by the corresponding intracellular protein level. Data represent the mean of three independent assays.
