
Figure 7.
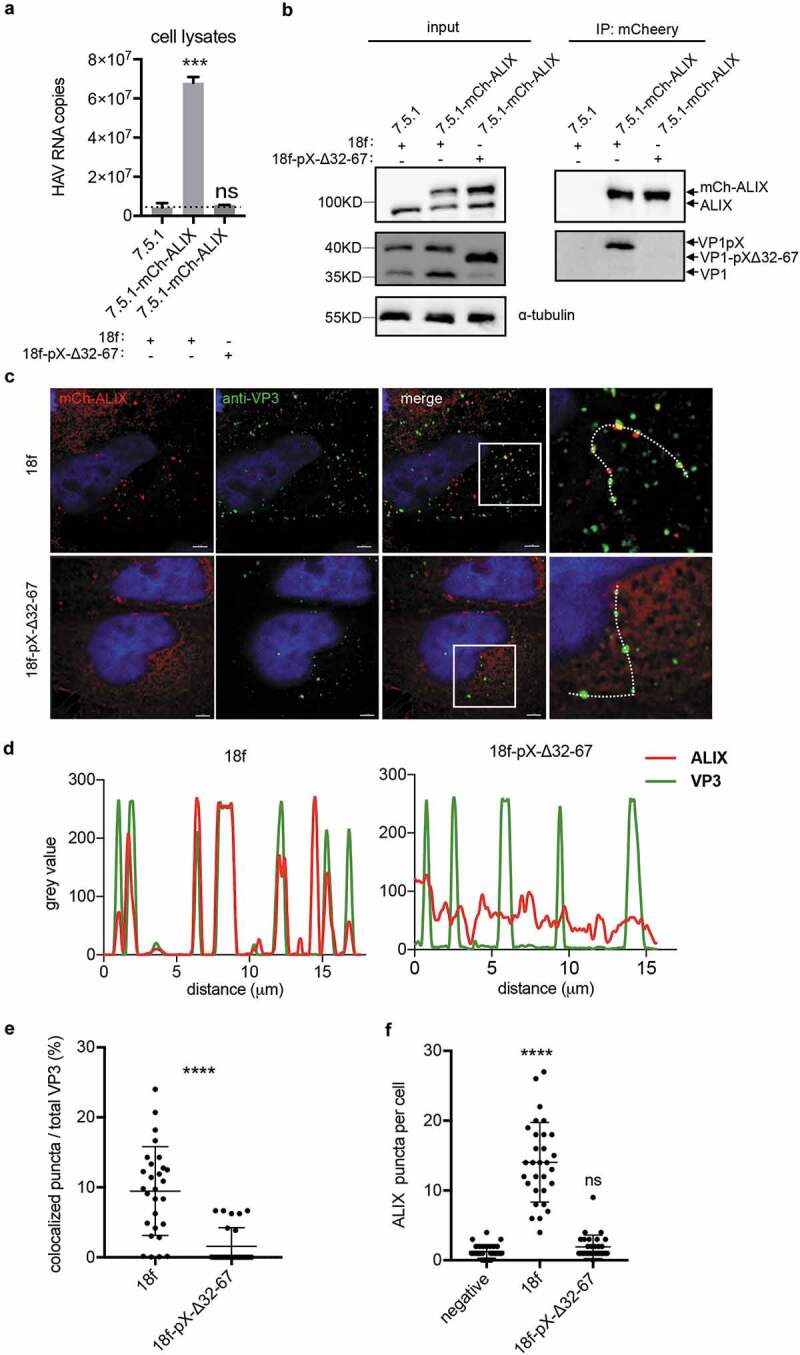
Deletion of the C-terminal half of pX affects the interaction between ALIX and HAV particles. (a)(b) Co-IP assay of the HAV-infected cell lysates using anti-mcherry antibody. Cell lysates were acquired by lysing cells with IP lysis buffer as described in the Methods section. Equivalent amounts of RNA samples were used to perform the co-IP assay. HAV genomic RNA was quantified by qPCR. Dotted line represents the qPCR detection background (a). Data are shown as the mean of three independent assays. Protein was detected by Western blot analysis (b). (c) Immunofluorescence analysis of HAV VP3 and ALIX. mCh-ALIX-expressing Huh7.5.1 cells were infected with HAV virus (MOI=5) as indicated. Forty-eight hours after infection, the cells were fixed with 4% paraformaldehyde as described in the Methods section. Images were acquired along the z-axis (step: 200 nm) with a DeltaVision Elite microscope, and one slice is shown. (d) Colocalization analysis of ALIX and VP3. The intensity of green/red fluorescence along the dotted line in Fig. 7C was evaluated by Fiji. (e) Statistical analysis of ALIX/VP3 colocalization. Spots containing colocalized ALIX and VP3 were counted and divided by the total number of VP3 spots to obtain a ratio. (f) Statistic analysis of the numbers of ALIX puncta per cell. ALIX puncta were counted in at least 30 cells in each experimental group.