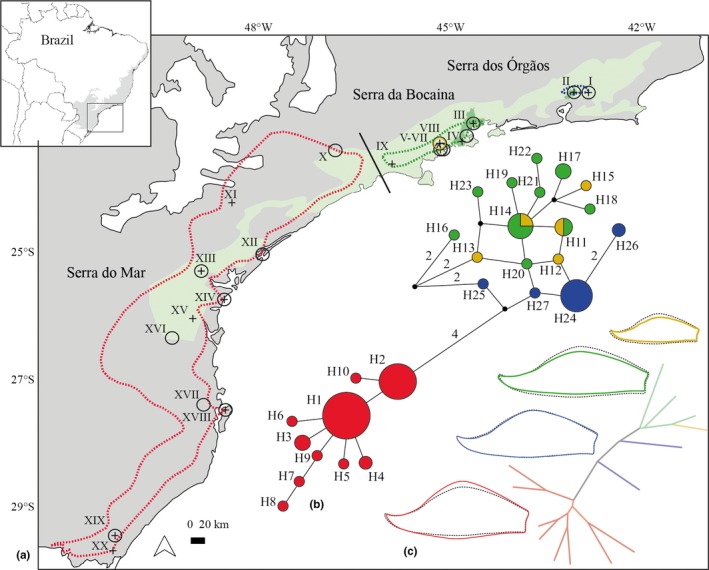
Figure 1.

(a) Distribution of taxa based on herbarium records: Vriesea taritubensis var. brevisepala in blue, V. taritubensis var. taritubensis in green, V. taritubensis var. patens in yellow and V. incurvata in red. Sampling localities marked with a circle for morphological data and a cross for genetic data (see codes in Table S1, Appendix S2). The Atlantic Forest (grey), Serra do Mar (light green) and Serra dos Órgãos and Serra da Bocaina (dark green) are shown. The black line shows a major break in species distribution between the Serra da Bocaina region and southern Atlantic Forest. Map of Brazil with the Atlantic Forest area in upper left. (b) A median‐joining network shows two main haplogroups, only V. taritubensis var. taritubensis and V. taritubensis var. patens shared haplotypes; each circle represents one haplotype, with its diameter proportional to its total frequency; more than one mutational step are indicated by numbers. (c) The Neighbour‐joining tree shows the distance in bract shape among localities. The consensus shapes for each taxon (coloured line) and for the whole sampling (black dotted line) display changes from lanceolate to wide‐elliptic [Colour figure can be viewed at http://wileyonlinelibrary.com]
