
Figure 2.
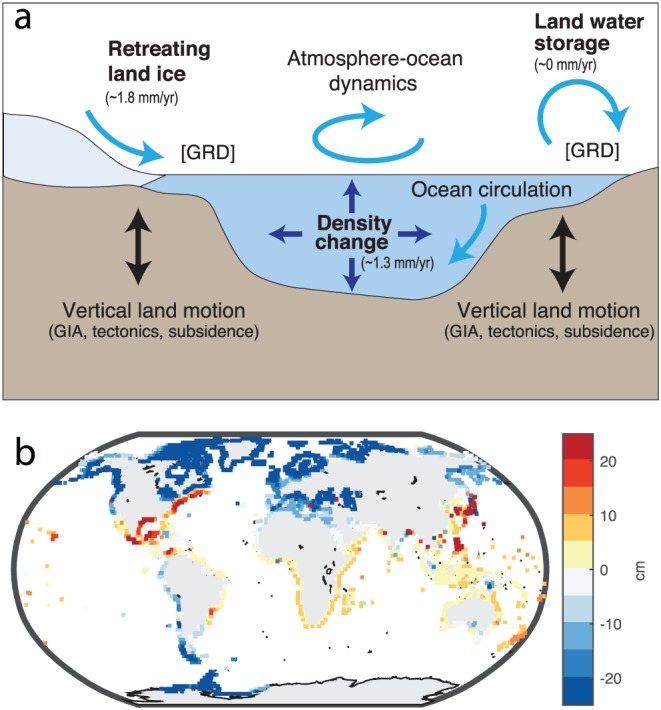
(a) Factors driving GMSL and RSL change. Bold labels identify process that drive GMSL change, with approximate average contributions over 1993–2017 shown (Mouginot et al., 2019; Rignot et al., 2019; WCRP Global Sea Level Budget Group, 2018; Zemp et al., 2019). Adapted from Milne et al. (2009). (b) Difference between median RSL and median GMSL projection under RCP 8.5 in 2100, based on the projections of Kopp et al. (2014).