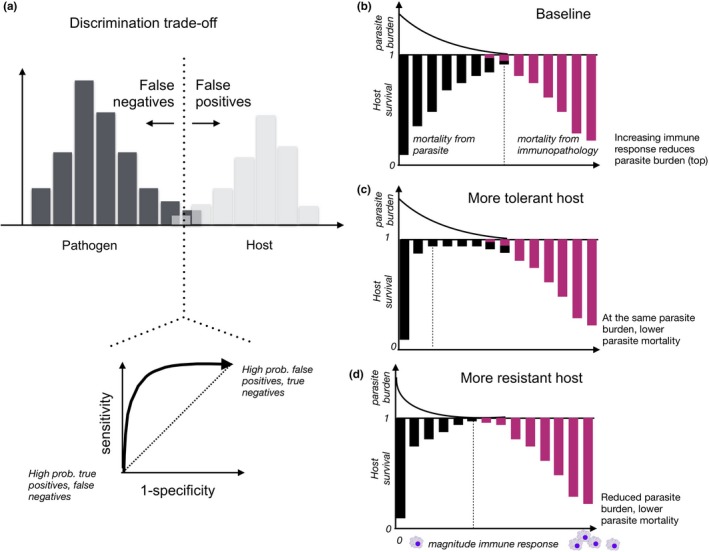
Figure 3.

Immune trade‐offs. (a) A discrimination trade‐off: distinguishing between overlapping molecular signatures of the host (grey histogram) and pathogens (black histogram), or deciding where to draw the dashed vertical line, results in a trade‐off between false positive and false negatives (this is framed as a sensitivity/specificity trade‐off by epidemiologists, lower panel). (b) A trade‐off around the magnitude of the immune response: large responses (x‐axis, response magnitude increases left to right) reduce parasite burden (top panel, black line) and thus reduce the impact of parasites on mortality (lower panel, the black bars reflecting how parasites reduce host survival diminish in size) but increase negative effects associated with immunopathology (lower panel, purple bars reflecting how immunopathology reduces host survival increase in size). The optimal response is where the combined burden of parasite‐associated mortality and immunopathology‐related mortality is the smallest (vertical dashed black line). Relative to this baseline, hosts might be (c) more tolerant, where the trajectory of parasite burden (top panel) is unchanged but the impact of parasites on survival is reduced (black bars are smaller, noting that impacts might manifest via fertility instead), or (d) more resistant, where the parasite burden is lower for equivalent magnitude immune responses. The base case (b) represents the trade‐off directly emerging from danger associated with immunity, but both tolerance and resistance will require additional resource allocation, and are thus often found to trade‐off. Tracing these four trade‐offs across the life span is an important direction for future work
