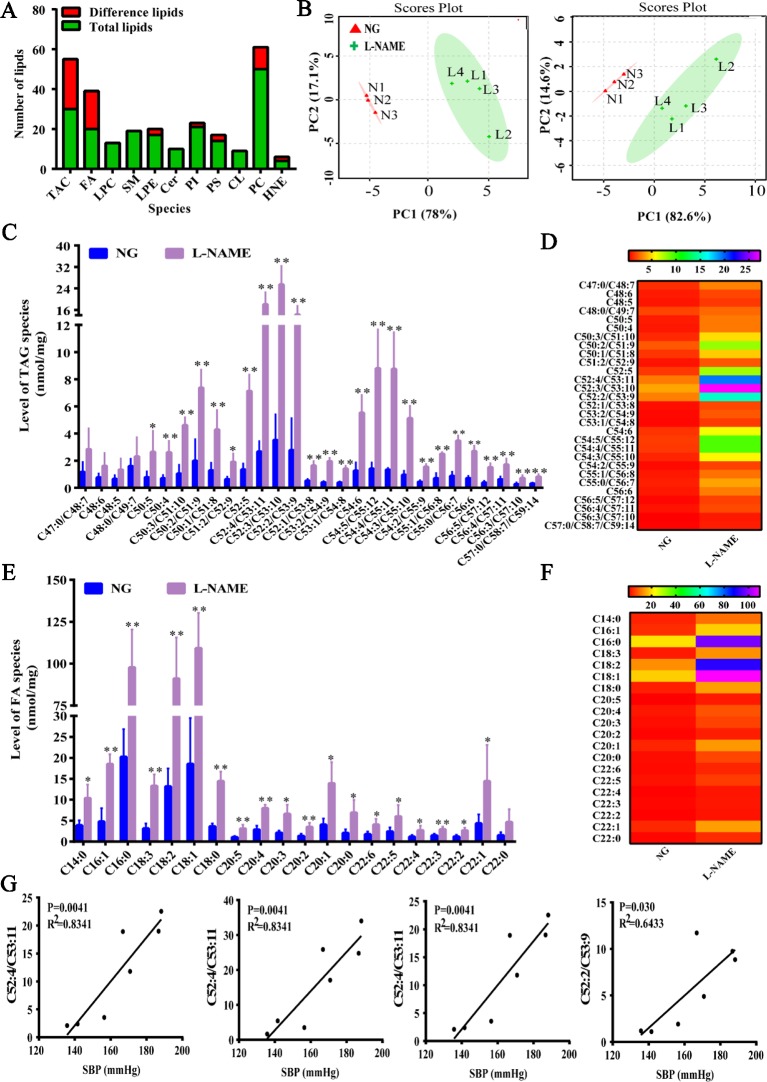
Figure 3.
Changes of total liver lipids, triglycerides, and fatty acids of liver in the L-NAME-treated rats. (A) Changes of a number of lipids. (B) PCA of TAG (left) and FA (right) in the liver. (C) Mass level of TAG species in the liver. (D) Heat map of TAG in the liver. (E) Mass level of FA species in the liver. (F) Heat map of FA in the liver. (G) Correlation analysis between the top four contents of TAG and SBP in the liver of rats. The data were expressed as means ± SEM. Significant differences are indicated by *P < 0.05, **P < 0.01 as compared with the NG (n = 3~4 per group).

