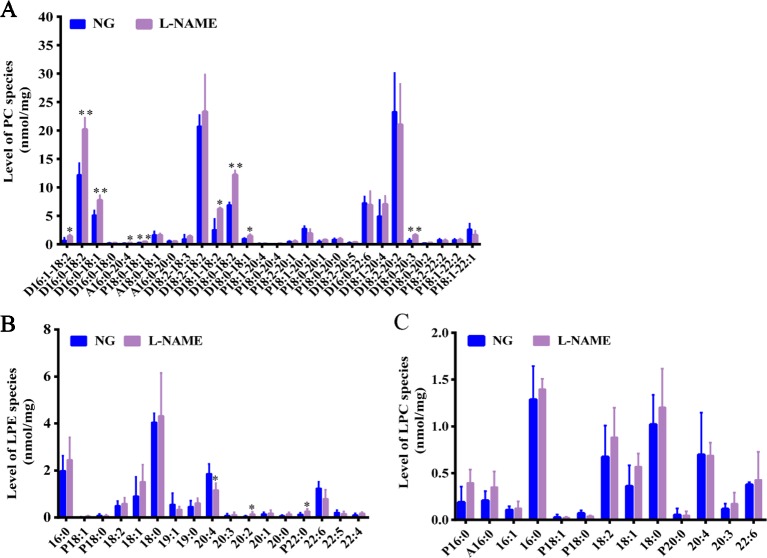
Figure 4.
Slight changes of hepatic phospholipid classes in the L-NAME-treated rats. (A) Mass level of PC species in the liver. (B) Mass level of LPE species in the liver. (C) Mass level of LPC species in the liver. The data were expressed as means ± SEM. Significant differences are indicated by *P < 0.05, **P < 0.01 as compared with the NG (n = 3~4 per group).

