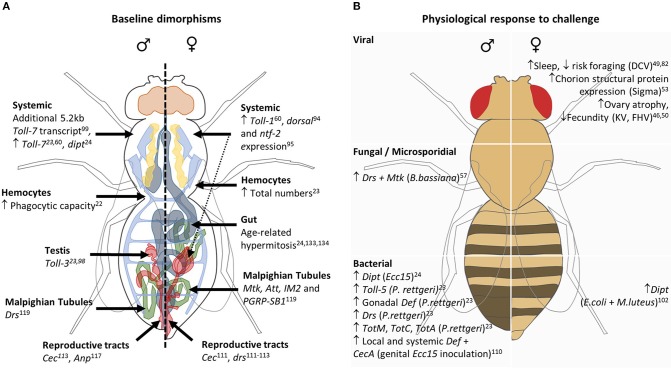
Figure 2.
Schematic representing sexual dimorphisms in innate immunity at basal state (A) and in physiological responses to immune challenge (B). (A) Male- and female-specific baseline conditions are depicted on the left and right of the central dashed line, respectively. Greater expression/ numbers are denoted by an upward-facing arrow, while stand-alone genes belonging to systemic or specific tissues represent sex-specific expression systemically or within that tissue, respectively. The dashed arrow represents the potential contribution made by the ovaries to observed differences in systemic transcript abundance. (B) Male (left column) and female (right column) physiological responses to viral, fungal/microsporidial, and bacterial are listed, with the causative pathogen in brackets. Increases and decreases in expression or behaviors are denoted by upward- and downward-facing arrows, respectively.

