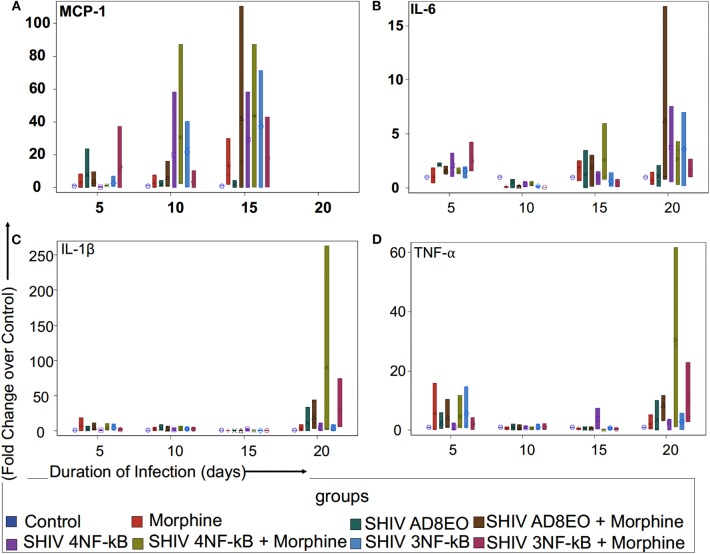
Figure 2.
Proinflammatory cytokine and chemokine response during opioid-exposure and SHIV infection of RM-PBMCs. Expression levels of (A) MCP-1, (B) IL-6, (C) IL-1β, and (D) TNF-α transcripts was quantitated by qRT-PCR during infection and morphine-exposure of RM-PBMCs with SHIV AD8EO, SHIV 4NF-κB, and SHIV 3NF-κB. The analysis of boxplot showed the distribution of the fold change in expression of each transcript, normalized to GAPDH and relative to the expression of the control group in different treatment groups at each time point. The minimum, first quartile, median, third quartile, and maximum are indicated for each group (n = 3).

