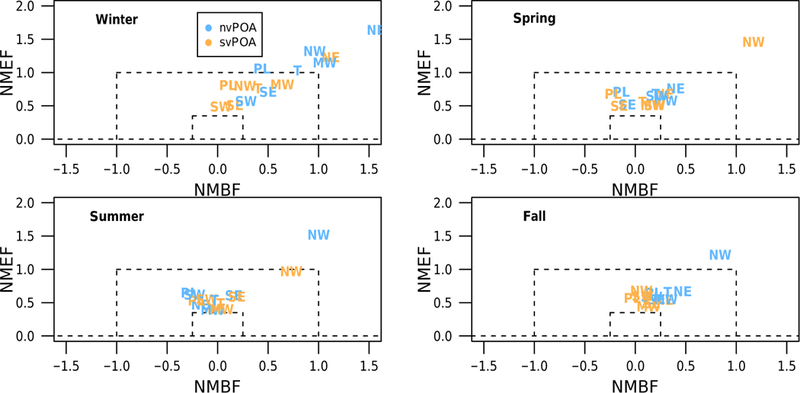
Figure 10.

Regional and seasonal model performance at routine-monitoring stations for the CONUS11 simulation as a function of the normalized mean bias factor (NMBF) and normalized mean error factor (NMEF) for OC predictions. Plotted regions include the northeast (NE), Midwest (MW), southeast (SE), Plains (PL), northwest (NW), southwest (SW), and total (T) and are defined as visualized in Fig. 8.
