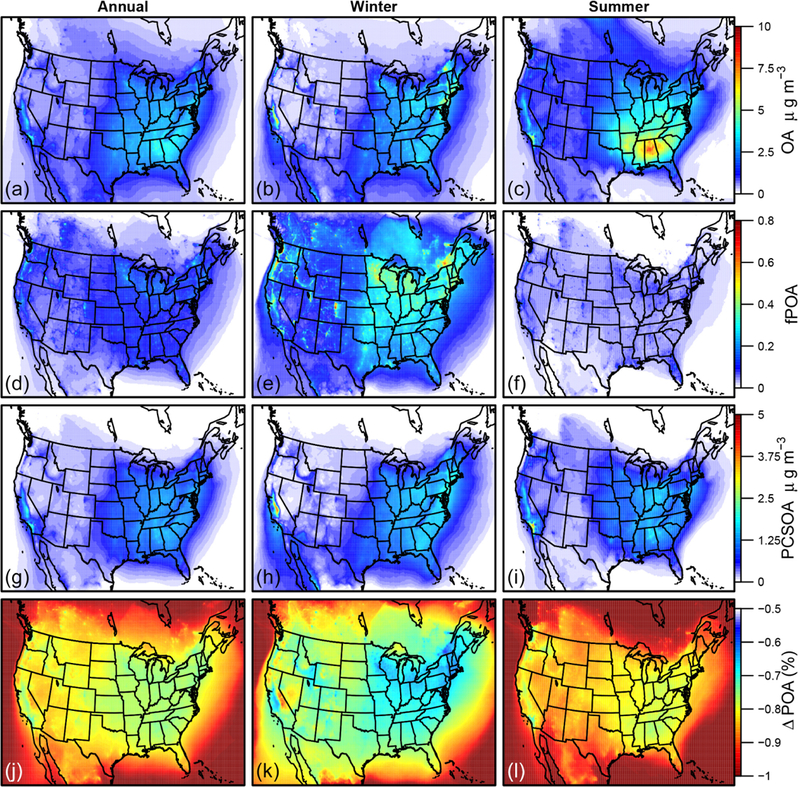
Figure 11.

Spatial distribution of products form the LEBR CONUS11 simulation. Products include the OA concentration (row 1), fraction of POA (row 2), pcSOA concentration (row 3), and change in model-predicted POA from the nonvolatile POA model to the semivolatile POA model (row 4). Maps illustrate the median of all annual surface data (a, d, g, j), winter months (December, January, February; b, e, h, k), and summer months (June, July, August; c, f, i, l).
