Figure 12.

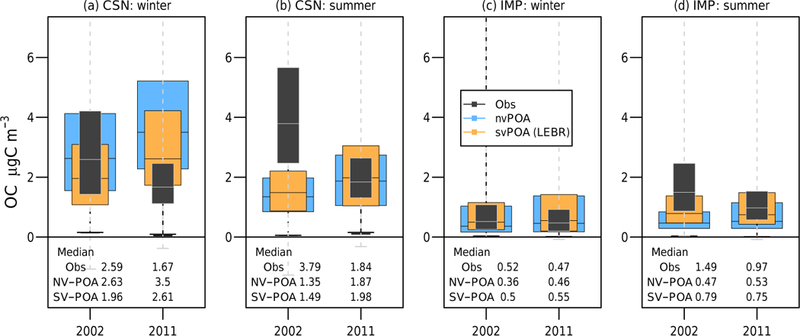
Organic carbon (OC) distributions for routine-monitoring stations and model predictions at the same locations and times. The meaning of the boxes and whiskers is explained in Fig. 5.

Organic carbon (OC) distributions for routine-monitoring stations and model predictions at the same locations and times. The meaning of the boxes and whiskers is explained in Fig. 5.