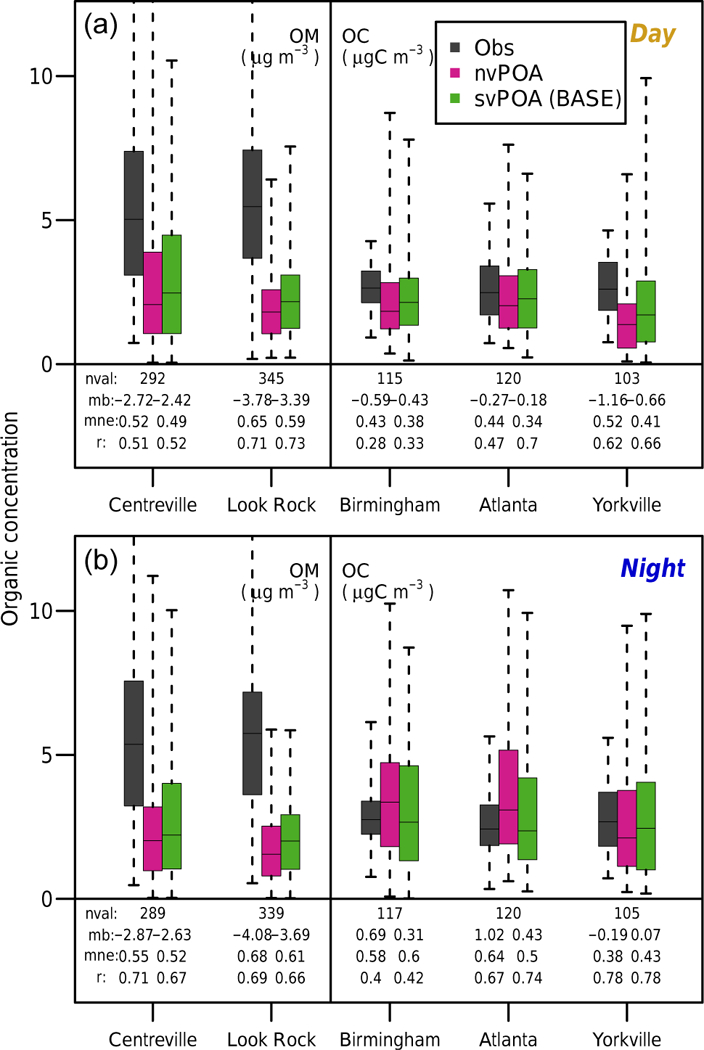
Figure 2.

Observed (gray) and modeled (pink, green) organic aerosol (μg m−3) and organic carbon (μgC m−3) concentrations at sites in the southeast US. OA concentrations at the SOAS sites, Centreville and Look Rock, were measured with HR-ToF-AMS, while OC concentrations at the SEARCH sites, Birmingham, Atlanta, and Yorkville were inferred as the difference between total carbon measured by ambient particulate carbon monitors and elemental carbon measured by aethalometers. Also shown are the model-predicted distributions at each site using the nonvolatile (pink) and base-case semivolatile (green) configurations. The boxes denote the 25th and 75th percentiles of each dataset, while the whiskers extend to the most extreme points. (a) and (b) show data for daytime (08:00–20:00) and nighttime hours, respectively. Model values for the SOAS sites are projected to PM1 to correspond roughly to the size cutoff of the AMS, while for the SEARCH sites the sum of the Aitken and accumulation modes was applied. All model data are produced from the EUS simulation, which uses SAPRC07tic and occurs during June 2013.
