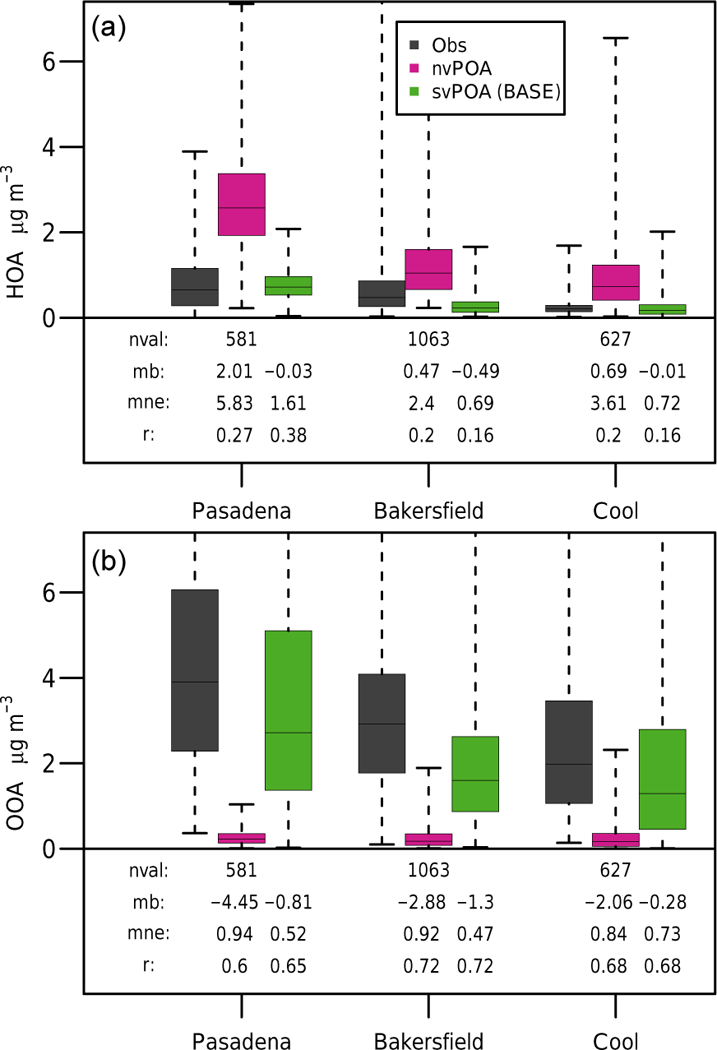
Figure 3.

Comparison of OA factors derived from positive matrix factorization (PMF) of HR-ToF-AMS observations (gray) at sites in California (Pasadena, Bakersfield, and Cool). Also shown are the model-predicted concentrations of each factor at each site using the nonvolatile (pink) and base-case semivolatile (green) configurations. (a) compares estimations for hydrocarbon-like OA (HOA) and (b) for oxygenated OA (OOA). The boxes denote the 25th and 75th percentiles of each dataset, while the whiskers extend to the most extreme points.
