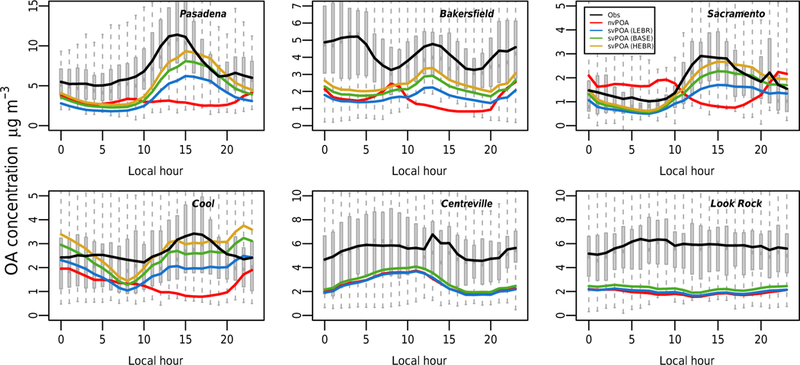
Figure 5.

Diurnal OA concentration profile (μg m−3) observed (black line, gray bars) with the HR-ToF-AMS at sites investigated during the CalNex, CARES, and SOAS campaigns. Also shown are the model-predicted distributions for the nvPOA case, the BASE case, and two sensitivity cases (LEBR and HEBR). The boxes behind each trend indicate the 25th and 75th percentiles of the data. The whiskers extend to the 10th and 90th percentiles. The solid horizontal lines in each box identify the median, and the solid curves indicate the means of each model run. Model values are projected to PM1 to correspond roughly to the size cutoff of the AMS.
