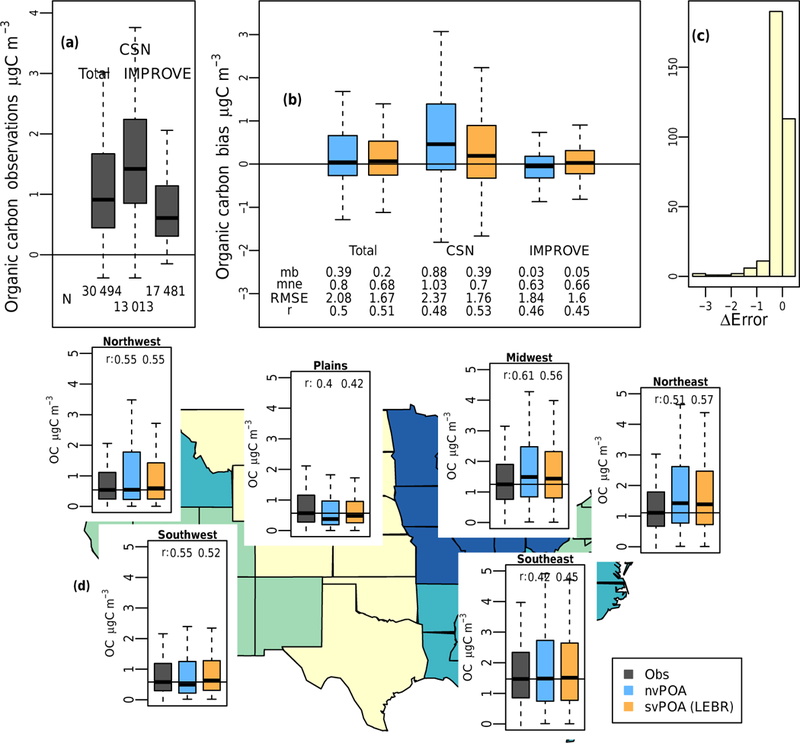
Figure 8.

Continent-wide organic carbon (OC) evaluation of the nvPOA case and the best-performing sensitivity case (LEBR) against routine-monitoring data from IMPROVE and CSN sites for an annual simulation during 2011. (a) Distribution of OC observations from both networks individually and combined. (b) Distributions of OC bias for each network and combined. (c) Histogram of error changes from the nvPOA to the svPOA (LEBR) case at specific stations aggregated throughout the year. (d) Regional distribution of OC observations and predictions throughout the annual simulation
