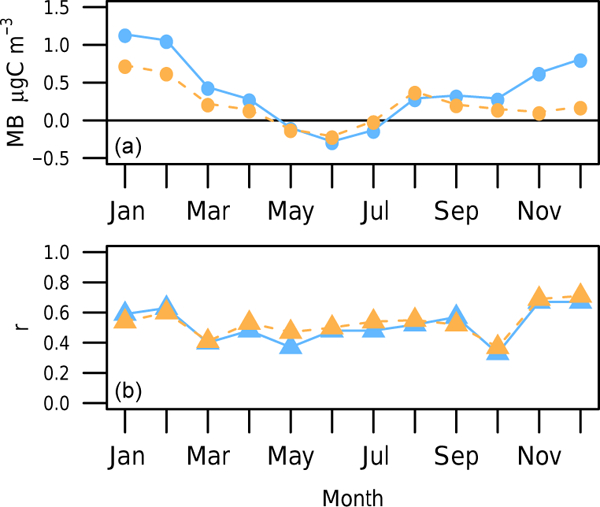
Figure 9.

Monthly model performance for the nvPOA (blue) and LEBR (orange) cases throughout the 2011 simulation. The top panel indicates the mean OC bias, while the bottom panel indicates the correlation coefficient of each model run with the CSN and IMPROVE observations.
