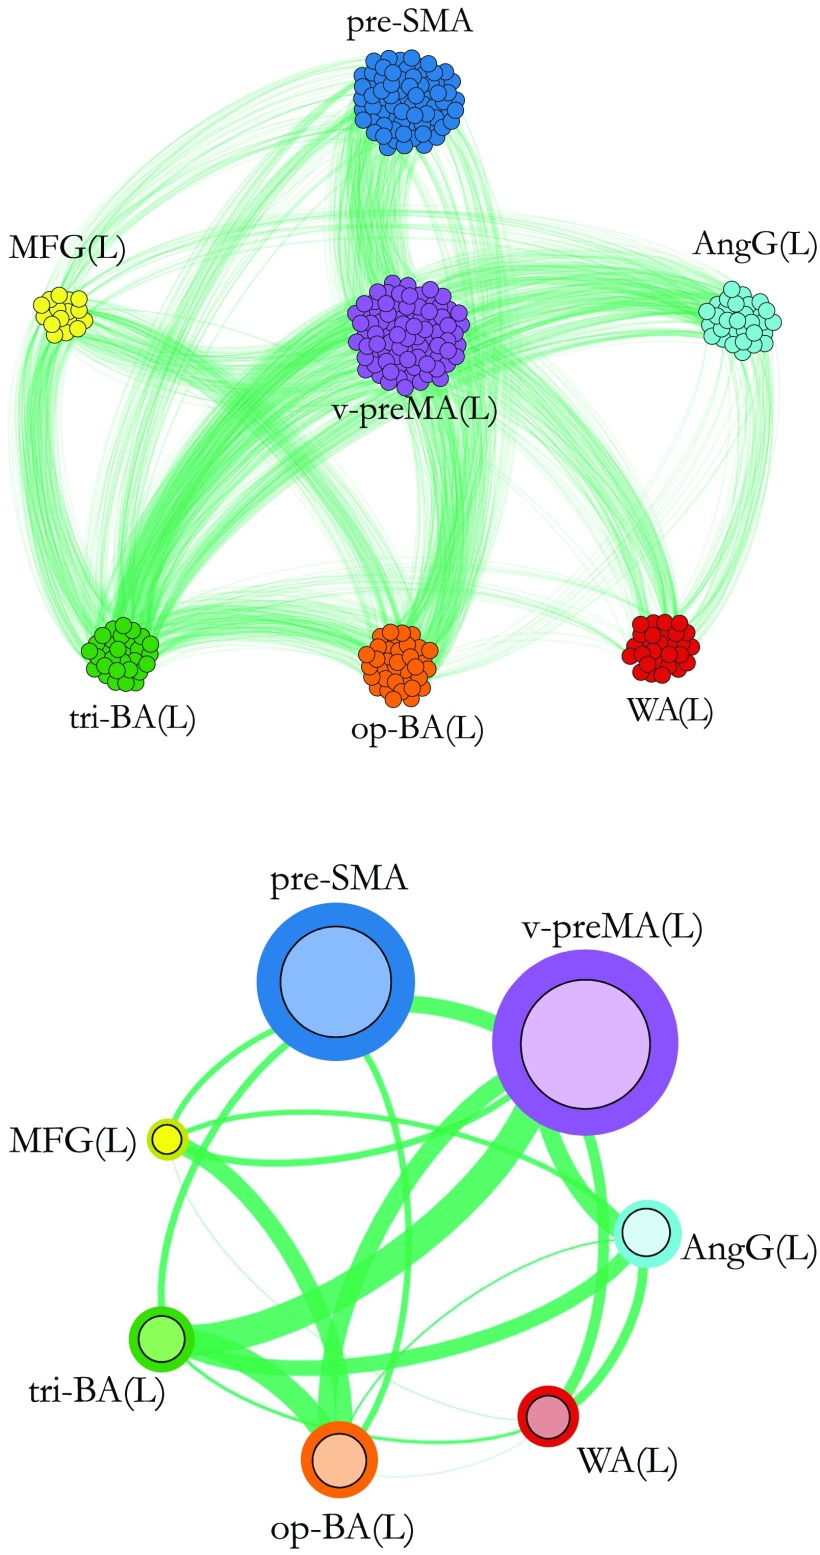
Figure 2. .
Two visualizations of the individual functional network. The figure shows functional networks for a representative subject relative to the fMRI active brain areas during the language task. Upper panel: voxel-level network. Each node in the network represents a voxel, each link connects a pair of voxels in different brain modules, and it is indicative of functional interdependency. Links connecting voxels within the same brain module are not visible but exist. Lower panel: fROI-level network for the same voxel-level architecture shown in the upper panel. Voxels belonging to the same anatomical region are grouped into an fROI, represented as a node in the network. Node’s size is proportional to the number of voxels in the fROI. Colored borders have no meaning and are used only for illustrative purpose. Each link’s thickness connecting two fROIs is proportional to the sum of link’s weight connecting all the voxels in the two fROI (exact definition given in Equation 2).

