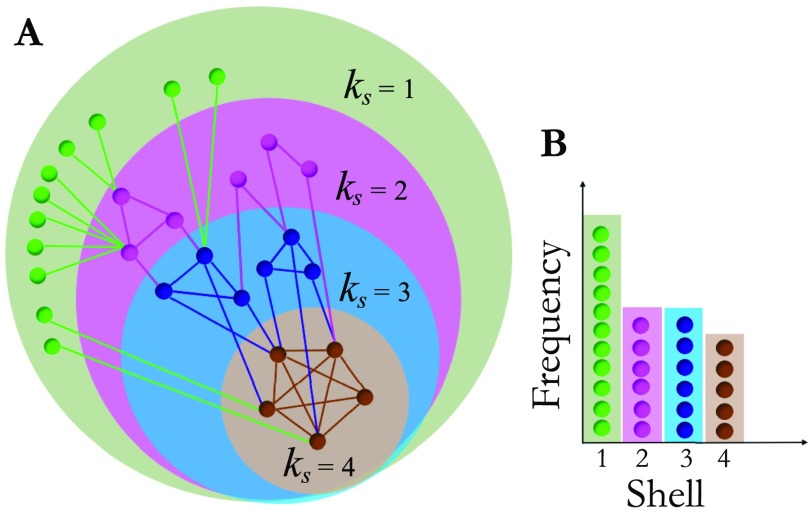
Figure 4. .
k-core and k-shell of a network. Panel A illustrates pictorially a network. Nodes in the same disk have the same k-core. A k-core structure includes subnetworks with higher ks, so the 1-core includes the 2-core which, in turn, includes the 3-core, and so forth. Nodes that are in the k-core but not in the k + 1-core are called k-shell and are colored differently. The maximum k-core coincides with the maximum k-shell, in this network is kcoremax = 4 and depicted with brown nodes. Panel B illustrates pictorially the construction of the k-core histogram shown in Figure 5. Note that here nodes in each k-shell are colored differently, whereas in Figure 5 different colors indicate nodes in different fROIs, piled up according to their k-shell as in this panel.

