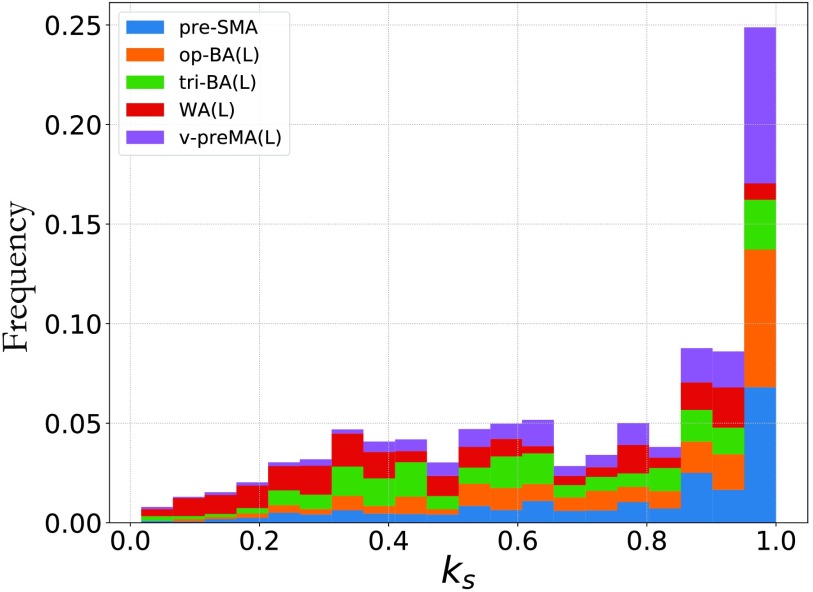
Figure 5. .
k-shell occupancy. The histogram shows the k-shell occupancy for nodes in the four fROIs of the common network of Figure 3. Overall, the majority of the nodes of this structure are located in the maximum k-shell, which coincides with , a quantity linked to the robustness of a complex network (Morone et al., 2019). Of the four fROIs of the common network, the pre-SMA, op-BA, tri-BA, and ventral preMA are mostly part of the . Wernicke’s area (WA) is more an outlier; it is mostly located in lower k-shells and minimally located in the .

