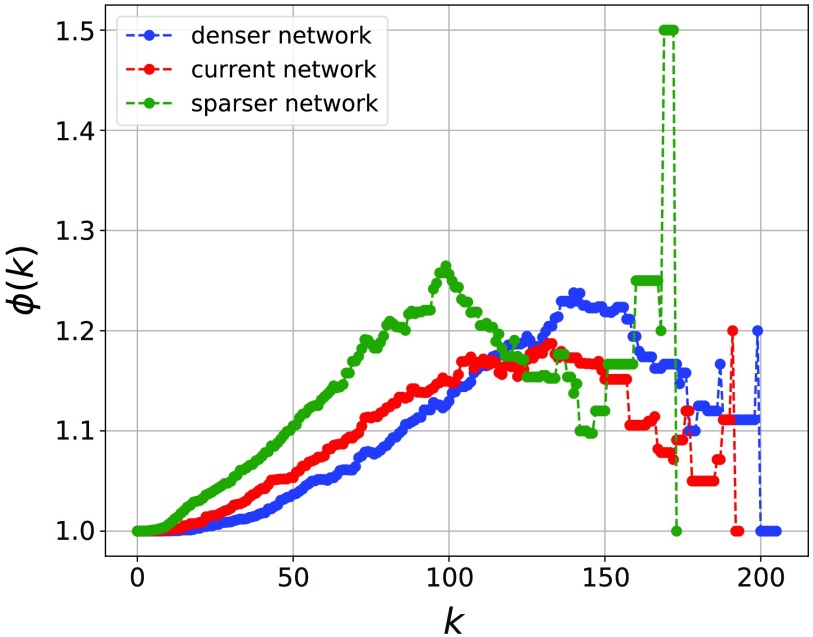
Figure 6. .
Rich clubs. Normalized rich-club coefficients for a representative subject with 5% (lowered/raised) variation of the current threshold. All other subjects have qualitatively the same normalized rich-club coefficient. The red curve corresponds to the original threshold (network). The blue curve corresponds to a 5% lower variation of the threshold, which leads to a denser network. The green curve corresponds to a 5% higher variation of the threshold, which leads to a sparser network. The figure shows rich-club behavior of the functional brain network, showing an increasing normalized rich-club coefficient.

