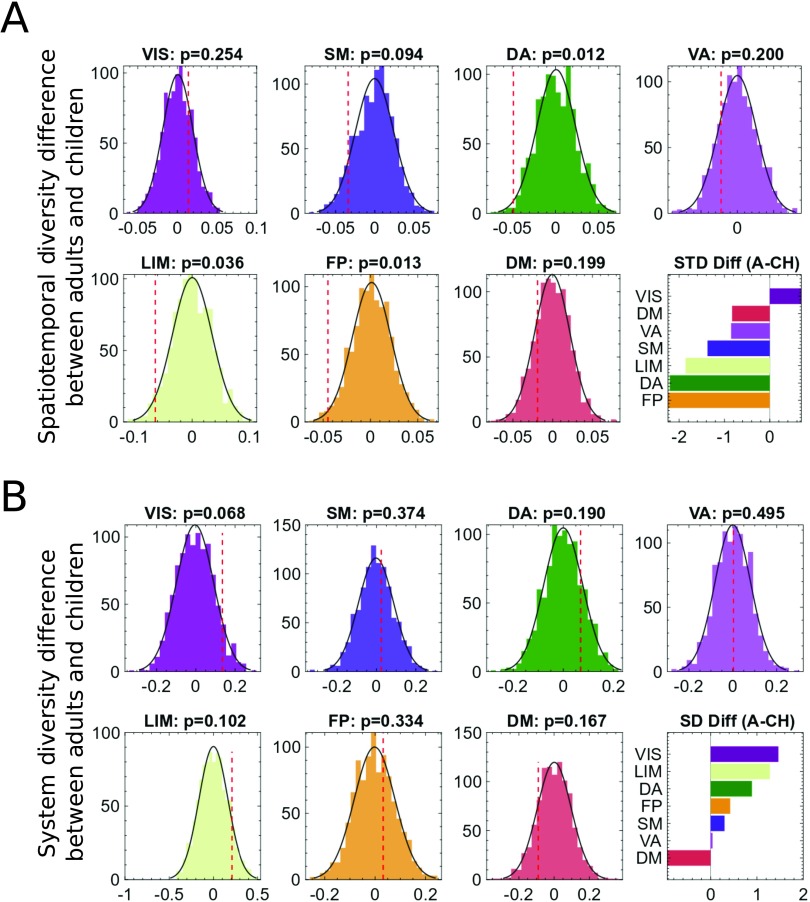
Figure 3. .
Spatiotemporal diversity (STD) and system diversity (SD) at functional system level. Comparison of SD and STD between the two age groups of adults (A) and children (CH) for individual functional systems between the real value (dashed red line) and its null distribution. (A) STD for individual functional systems between the groups (STD, frontoparietal (FP): p value = 0.021, dorsal attention (DA): p value = 0.024, limbic (LIM): p value = 0.031, one-tailed permutation test FDR corrected). (B) SD for individual functional systems between the groups.

