Figure 4. .
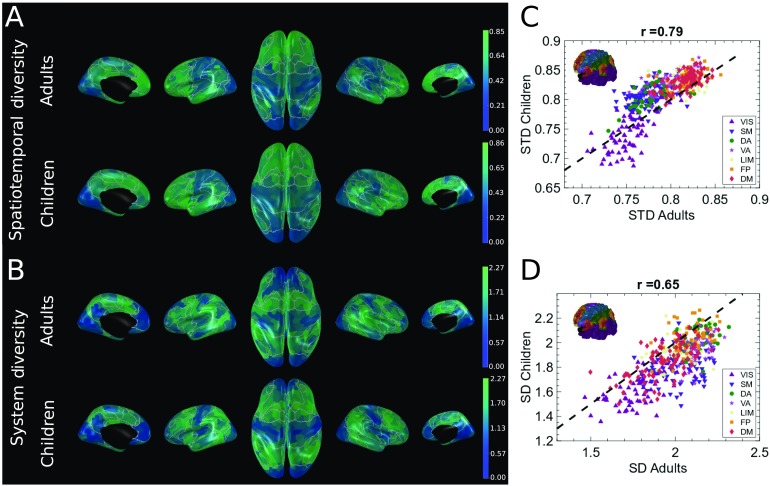
Cortical patterns of spatiotemporal diversity (STD) and system diversity (SD) values in children and adults. Every brain map represents values of STD and SD for the 448 cortical nodes. (A) Cortical maps for STD of the adults and children groups. (B) Cortical maps for SD of the adults and children groups. Correlation plots represent the relationship between the STD and SD values of the two groups. Dashed black line stands for the identity line, with different colors representing different functional systems: visual (VIS; purple), somato-motor (SM; blue), dorsal attention (DA; green), ventral attention (VA; pink), limbic (LIM; yellow), FP (orange), default mode (DM; red). White demarcation lines represent the separation of the seven functional systems. (C) Correlation between STD adults and STD children (r = 0.79). (D) Correlation between SD adults and SD children (r = 0.65). The inserted brain in the correlation graphs represents the Yeo functional systems (Yeo et al., 2011).

