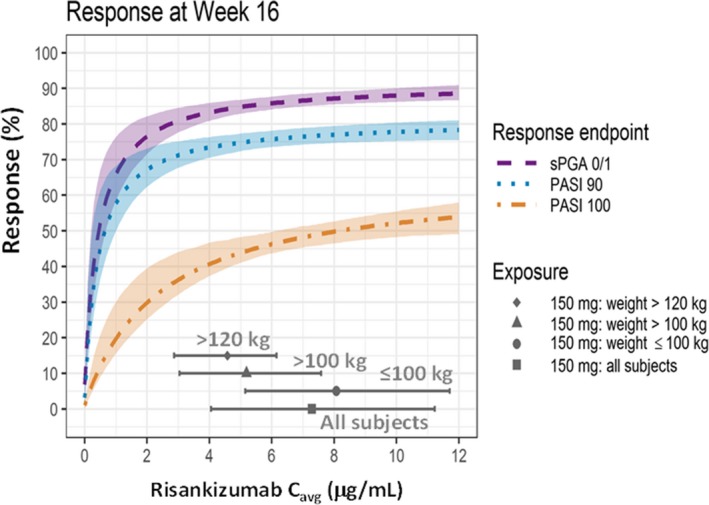
Figure 3.

Estimated relationships for PASI90, PASI100, and sPGA0/1 responses at week 16 and average risankizumab plasma concentration (C avg) and illustration of achieving plateau of response across body weight categories with the clinical regimen in psoriasis patients. Dashed lines and shaded area: Model‐predicted probability of response, median (dashed lines) and 95% confidence interval. Gray solid symbols (median) and lines (5th and 95th percentiles) represents distribution of risankizumab C avg values with phase III clinical dosing regimen of risankizumab (i.e., 150 mg SC at weeks 0 and 4 and every 12 weeks thereafter). C avg, average plasma concentration; PASI, Psoriasis Area and Severity Index; sPGA, static Physician's Global Assessment. [Colour figure can be viewed at http://wileyonlinelibrary.com]
