
Fig 6. The apparent Ca2+ affinity of release is decreased by hydrophobic mutations.
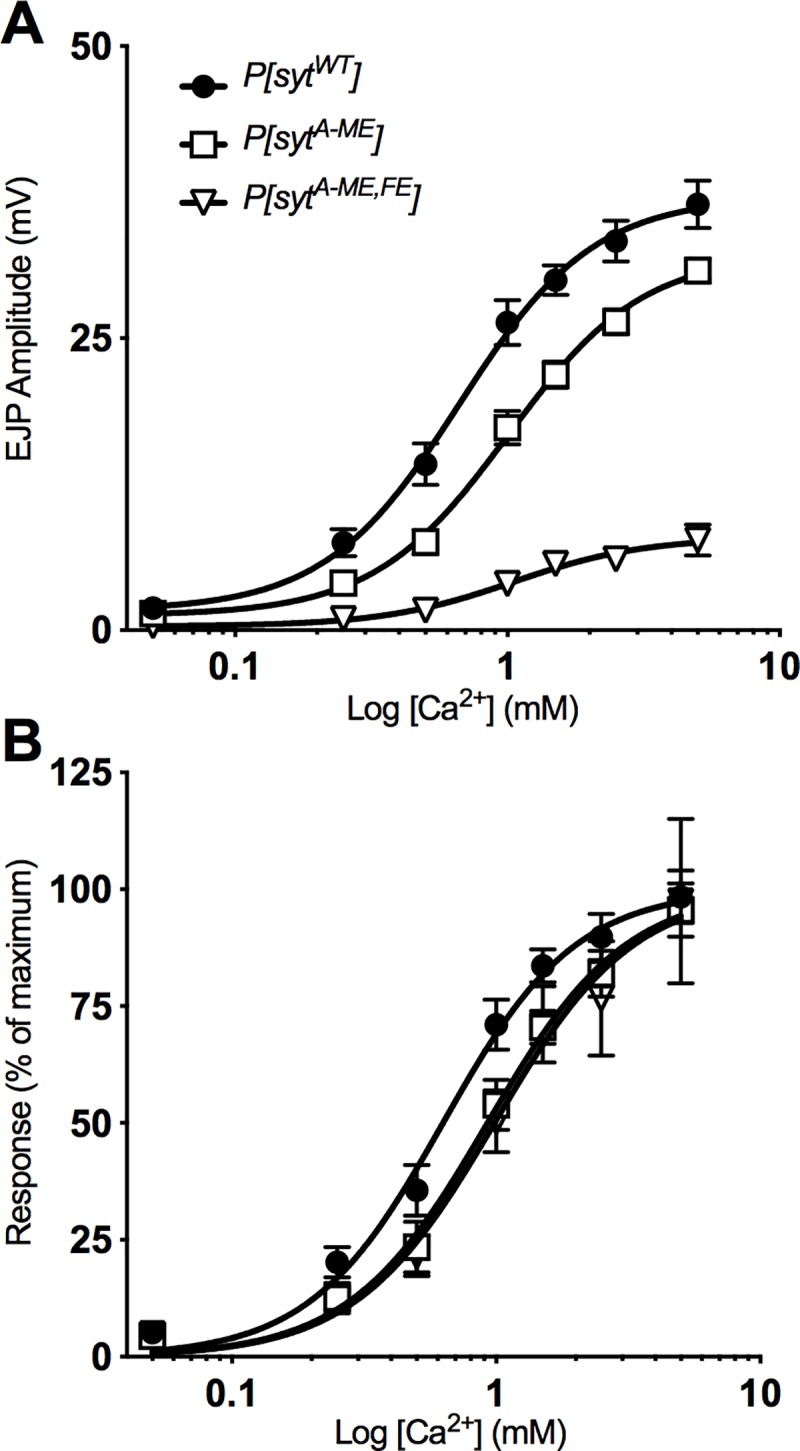
A, Mean EJP amplitude ± SEM across a range of Ca2+ concentrations fit with a nonlinear regression. B, Ca2+ curves normalized to maximum EJP amplitude predicted by the nonlinear regression. The significant rightward shift in the curve (EC50, non overlapping confidence intervals) indicates a decrease in the apparent Ca2+ affinity of neurotransmitter release.