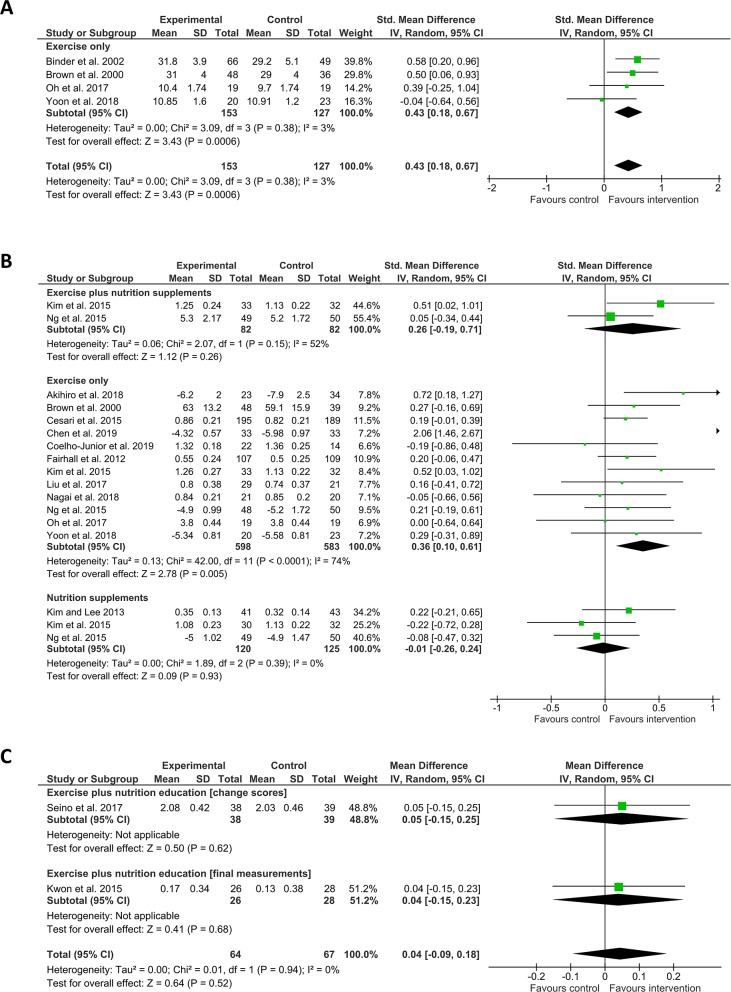
Fig 4. Effect of interventions on physical performance and gait speed.
A) Shows SMD (square data markers) with 95% CI (horizontal lines) for meta-analysis of mean scores ± SD for physical performance tests for interventions using exercise. B) Shows SMD with 95% CI for meta-analysis of gait speed as mean time taken to walk a set distance (measured in seconds) or mean speed ± SD (measured in metres per second) for interventions using exercise plus nutrition supplements, exercise only, or nutrition supplements only. C) Shows Mean Difference with 95% CI for meta-analysis of gait speed (measured metres per second), reported either as change scores or as final measurements ± SD, separated into sub-groups for clarity, for interventions using exercise plus nutrition education. Size of data markers indicates study weighting in random effects meta-analysis. Diamond-shaped data markers indicate overall SMD or Mean Difference with CI for each grouping of interventions. I2 statistic is reported for each group. Right side favours intervention.

