Figure 1.
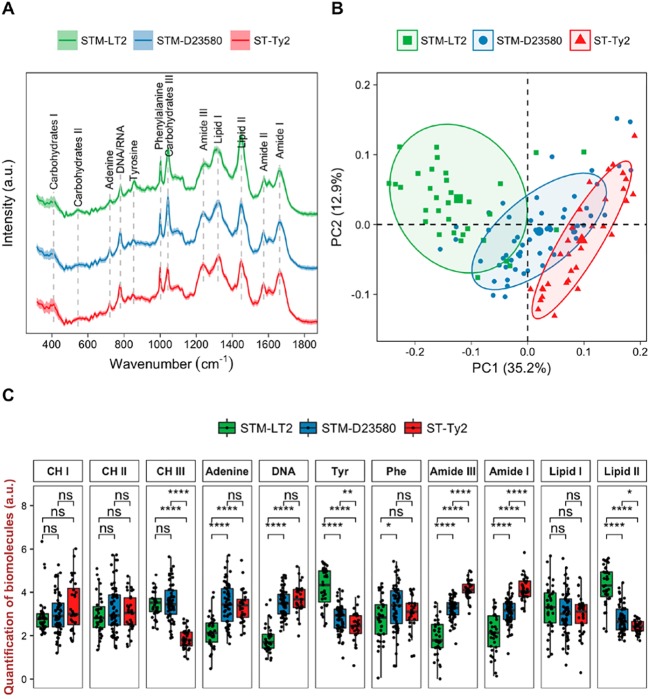
(A) Average SCRS of overnight cultures of STM-LT2, STM-D23580, and ST-Ty2 from 30 to 50 single-cell measurements. The shaded area in SCRS represents the standard deviation. (B) PCA plot based on the fingerprint region of the SCRS. (C) Boxplots show semiquantification of selected biomolecules by integrating relevant Raman bands. Statistics (Welch’s t test) indicates pairwise differences (ns: p > 0.05; *: p < 0.05; **: p < 0.01; ***: p < 0.001; ****; p < 0.0001). “CH” represents “carbohydrates”; “DNA” represents “DNA/RNA”; “Tyr” represents “tyrosine”; “Phe” represents “phenylalanine”.

