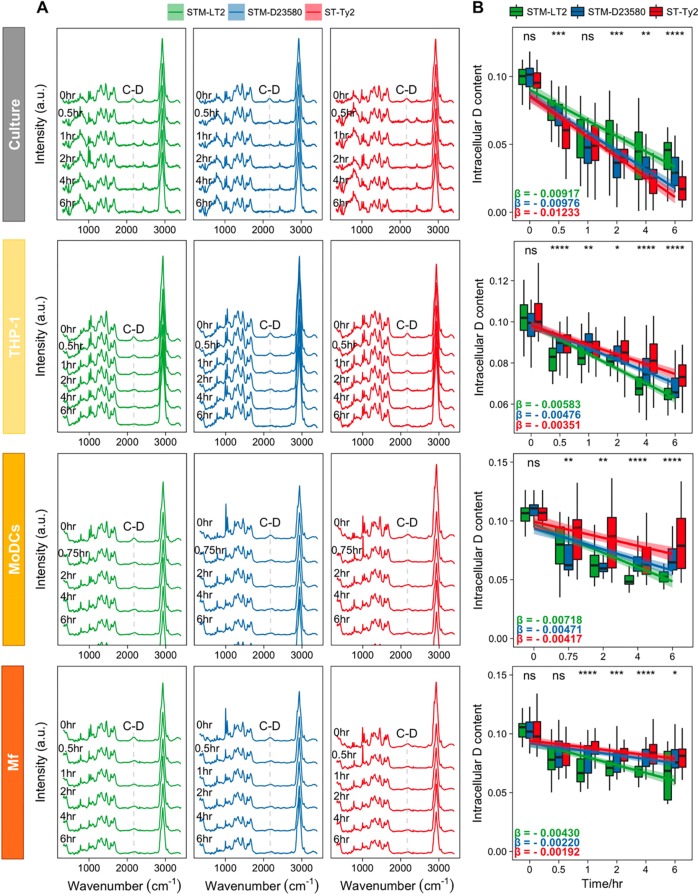
Figure 2.
(A) SCRS of Salmonella serovars under four experimental conditions: extracellular growth in liquid culture and intracellular metabolism during infection of a differentiated THP-1 cell line, primary MoDCs, and primary Mf (the band at ∼2500 cm–1 in the “culture” panel is instrumental artifact and it has been corrected in later measurements). (B) Boxplots quantifying D content at different time points. Statistics was done with one-way ANOVA (ns: p > 0.05; *: p < 0.05; **: p < 0.01; ***: p < 0.001; ****; p < 0.0001). The absolute value of linear regression slope β represents the metabolism speed.

